Each day, millions of people between the ages of 16 and 24 don’t attend school or head to work. Instead, these young people—often called opportunity youth—face greater risk of social exclusion, poverty, and falling behind without the skills to improve their lives. For employers looking to hire, these young people represent a critical opportunity to help build their talent pipelines for the future. The Schultz Family Foundation, through the 100,000 Opportunities initiative, is helping connect young people to meaningful work in seven demonstration cities—Atlanta, Chicago, Dallas, Los Angeles, Phoenix, Seattle, and Washington, DC—through training programs, hiring fairs, and employer support provided by community-based organizations.
But efforts like this to connect opportunity youth with employers looking to hire would be better served by more timely and detailed information on the scale and nature of youth unemployment. Currently, those interested in targeting their resources and programs have access to timely but limited data on youth employment from the Bureau of Labor Statistics, or more complete but less timely retrospective studies such as the Measure of America. Timely estimates for specific subgroups and geographic areas would not only help target resources more effectively but also help organizations like the Schultz Family Foundation and others track progress over time.
Mathematica is working with the Schultz Family Foundation to address this issue and provide more timely, more detailed data. Using the Bureau of Labor Statistics’ monthly labor force statistics for youth unemployment by age group, race and ethnicity, and gender, and the Current Population Survey’s data on youth unemployment in metropolitan areas, we were able to produce semiannual snapshots for specific demographic groups and geographic areas.
To ensure that these new data points are relevant within the context of existing data sources, we continued to use the Bureau of Labor Statistics’ definitions in our calculations.
Our first round of estimates—covering the first half of 2019—show that youth, particularly those ages 16 to 19, face a remarkably higher risk of unemployment. African American youth have the highest unemployment rates, and male youth are more likely to be unemployed than female youth. Our original estimates by geographic areas show that youth unemployment significantly varies by city.
Youth are nearly three times more likely to be unemployed than working-age adults
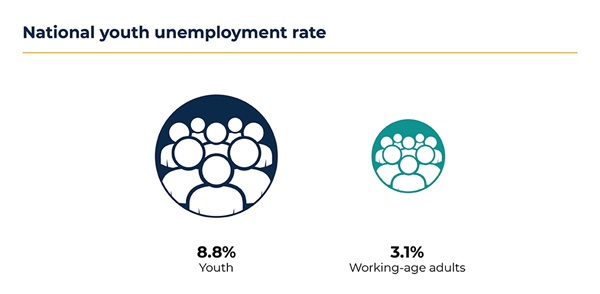
In the first half of 2019, the youth unemployment rate (ages 16 to 24) was 8.8 percent. That’s 2.9 times higher than the unemployment rate among working-age adults (ages 25 to 64), which was 3.1 percent.
Youth ages 16 to 19 face even higher unemployment than their older peers
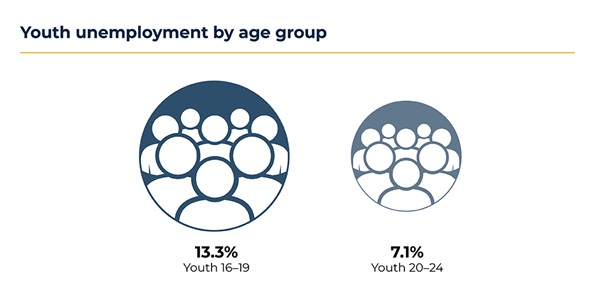
The unemployment rate for youth ages 16 to 19 was 13.3 percent, and it was 7.1 percent among youth ages 20 to 24.
Black and Hispanic or Latino youth face the highest risk of unemployment
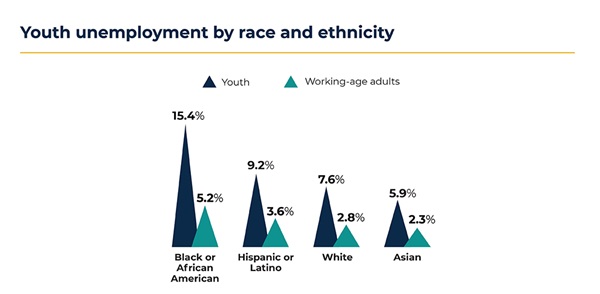
Racial and ethnic disparities in unemployment persist among youth and working-age adults. The unemployment rate was highest among Black or African American youth (15.4 percent), followed by Hispanic or Latino youth (9.2 percent) and White youth (7.6 percent).The unemployment rate was lowest among Asian youth (5.9 percent). The unemployment gap between youth and working-age adults was also highest among Black or African American youth; these youth were three times more likely to be unemployed than Black or African American working-age adults. In this analysis, people who define their ethnicity as Hispanic or Latino might be of any race.
Youth unemployment is higher among males than females
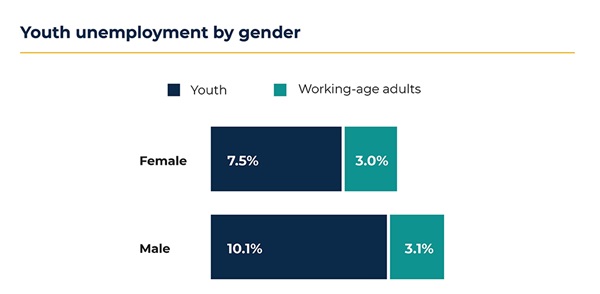
The unemployment rate was higher among male youth than female youth; however, the unemployment rate among working-age adults did not vary significantly between genders. Among male youth, the unemployment rate was 10.1 percent—3.2 times higher than that among working-age adult men. Among female youth, the unemployment rate was 7.5 percent— 2.5 times higher than that among working-age adult women.
Youth unemployment varies widely by city
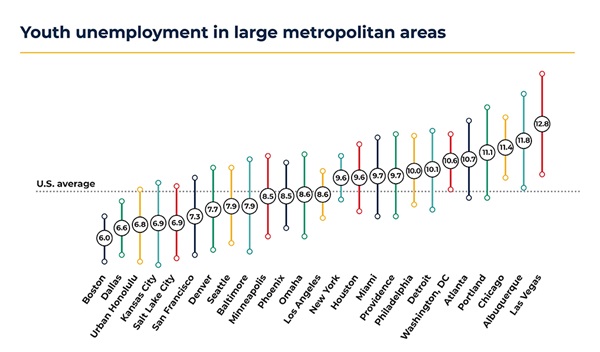
Note: Lines represent the margins of error that are based on a 90 percent level of confidence.
In the first half of 2019, youth unemployment rates (for those ages 16 to 24) varied among selected large metropolitan areas. With some exceptions, youth unemployment was generally higher in the Northeast and the South than it was in the West. The three metropolitan areas with the lowest youth unemployment rates were Boston (6.0 percent), Dallas (6.6 percent), and urban Honolulu (6.8 percent).The three metropolitan areas with the highest youth unemployment rates were Las Vegas (12.8 percent), Albuquerque (11.8 percent), and Chicago (11.4 percent).
Metropolitan areas are defined as Metropolitan Statistical Areas (MSAs). For example, Dallas refers to Dallas–Fort Worth–Arlington, Texas, MSA. We selected the presented metropolitan areas based on the size of the youth labor force in the sample and the margin of error around the point estimate.
The next round of estimates in the series covering the second half of 2019 will be available in early 2020, followed by an annual report that will disaggregate information for large metropolitan areas. These estimates will help the Foundation and other organizations focus attention on this important social issue.
Download infographic on youth unemployment in January-June 2019.
New: Download infographic on youth unemployment in July-December 2019.