
The rising cost of health care is arguably the biggest economic challenge facing the United States, with more than $3.6 trillion spent in 2018 alone. In Medicare, one way to tackle costs is through alternative payment models (APMs), which pay clinicians and hospitals based on the quality of care they provide, rather than on the quantity of services. The hope is that these models will reduce wasteful medical services and unnecessary spending. As of 2018, more than 13 million Medicare beneficiaries are being managed by one or more APMs.
With so many beneficiaries’ care falling under the management of APMs, the Centers for Medicare & Medicaid Services (CMS) is justifiably concerned about how these models will affect various patient groups. Rolling out an APM can be complicated—at the federal level, a large APM can involve managing billions of dollars in payments and penalties across thousands of health care providers. With millions of dollars at stake for many health systems, some providers might adopt cost-cutting practices that lead to worsening health outcomes, so we must carefully monitor the performance of APMs in real time. Mathematica has been working with a host of federal and state partners to implement APMs since 2012.
As health systems transition from simply performing services to instead providing high quality care under APMs, Mathematica works to identify best practices that can be shared across providers. We also identify pitfalls and problematic approaches to care delivery that might arise as a result of the model rules, enabling CMS to decide whether it needs to refine the model. In this way, the process of health care reform is like fixing a car while driving it.
Program monitoring: An early warning system
Program monitoring is an essential part of deploying a new APM and can provide an early warning when disparities arise. Based on what we’re now learning about disparities in health outcomes across socioeconomic backgrounds and the importance of looking at social determinants of health, program monitoring can play an even bigger role in ensuring that APMs provide cost-efficient, quality care, regardless of a patient’s background. In practical terms, this means incorporating patients’ race, economic status, social service needs, and residence into program monitoring to detect faulty APM design or inappropriate provider behaviors (intentional or unintentional) that are hidden from traditional accounting and actuarial analyses.
Our program monitoring analyses are often based on integrated data sets, which might include paid medical claims, social service screenings and referrals, data from electronic medical records, or public use files that describe community-level characteristics. We also study the APM’s rule set and consider if certain incentives might lead to behavior that widens disparities, such as avoiding costly patients.
For example, we are continuously monitoring patient-level outcome metrics for the Comprehensive Care for Joint Replacement (CJR) model, designed by the Center for Medicare and Medicaid Innovation to reduce expenditures for lower-extremity joint replacements (LEJRs). Based on our monitoring, quality and spending outcomes under CJR are encouraging. The first two performance years (2015 and 2016) demonstrated clear reductions in total 90-day episode spending for LEJRs, with no obvious decline in quality of care. With that said, access to LEJRs is still an unresolved question, as evidence suggests that some CJR hospitals are providing fewer LEJR services to lower-income and other patients who might have socioeconomic barriers to health care.
Consider a case in which a hospital denies access to patients with low income by reducing referrals or orthopedic consultations for patients who live in disadvantaged communities. Mathematica monitors such scenarios by assessing changes in the number of patients who receive LEJRs over time in different ZIP codes scored by the Area Deprivation Index (ADI). The ADI is a composite measure that identifies disadvantaged neighborhoods based on several financial and quality-of-life metrics and can indicate social service needs in an area. The index provides unique insight into the availability of social and communal support systems near a patient’s home; such systems are important for preventing adverse outcomes during surgical recovery.
One way that Mathematica monitors the CJR program is by looking for unexplained declines in LEJRs at participating hospitals for patients from disadvantaged neighborhoods.
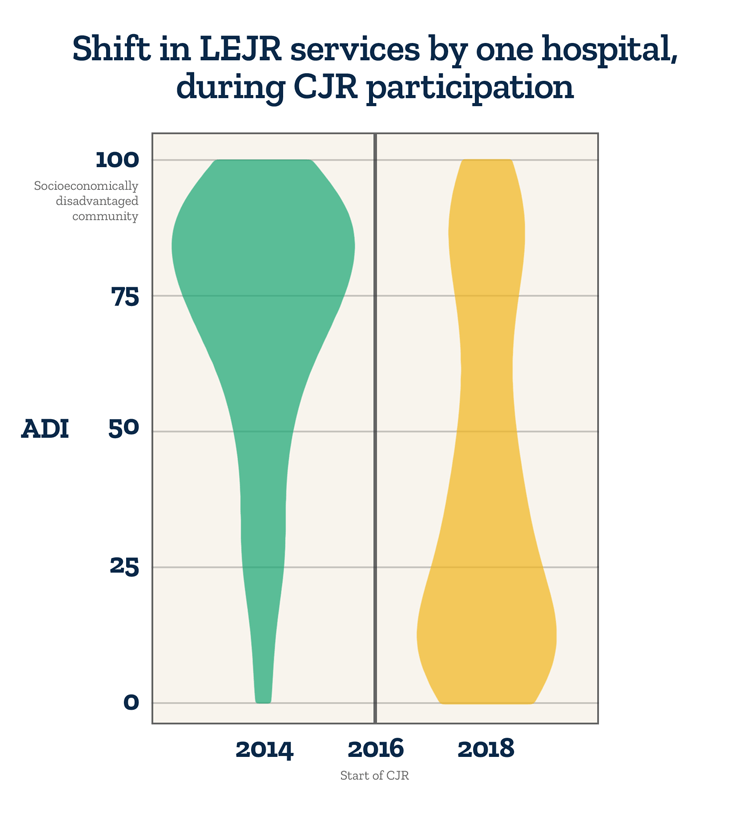
The figure shows how one CJR hospital changed its pattern of care delivery over the course of the CJR program. Before the program began in 2016, the hospital provided many surgeries to patients living in disadvantaged neighborhoods – areas with a high ADI score. But soon after the program started, this hospital began serving fewer of these patients and providing more surgeries to patients living in affluent neighborhoods.
To be clear, these types of changes do not prove access denial or issues with the integrity of hospitals, but they do raise concerns—patients living in poor neighborhoods have more expensive episodes of care, which is a potential incentive for CJR hospitals to reduce their access to LEJRs.
Iterating between program monitoring and implementation
At Mathematica, we believe the value of program monitoring is in iteration. In other words, by combining live program administrative data with vetted measures of socioeconomic status, we help clients and stakeholders understand APM behavior and make incremental improvements. Those program improvements are reflected in new administrative data, and the iterative cycle continues.
After we discover the potential for inappropriate activity (such as denying access for low-income patients), we develop algorithms that detect statistical outliers in order to find the subset of hospitals that may be engaging in unwanted practices or otherwise contributing to poor outcomes. For the CJR program, we combed through the details of LEJR episodes at these hospitals and explored their practice patterns through small-scale, hospital-focused quality metrics. Equipped with this information, we could then engage APM administrators and develop action plans to resolve issues at the APM and hospital level.
Through such interventions, program monitoring can effectively inform a number of client actions, such as:
- Modifying APM operations or participant rules to stop program gaming
- Engaging a Learning System to reach out to and better support hospitals that may be struggling with participation in the APM
- Notifying APM participants that they must take corrective action
As the action plan unfolds, Mathematica continues monitoring APM operations for all participants, with a focus on outlier hospitals. Throughout this process, we learn valuable lessons on program design and monitoring analytics. This is the power of iteration between program monitoring and implementation—we can see problems on the horizon and alter our course.
APMs require major investments from federal and state governments, and those investments can be safeguarded through program monitoring. As we look to the future of APMs, we will continue to adapt our analytic approaches to study disparities in access to high quality care through the lens of social determinants of health. APMs must work for all patients, including those from disadvantaged communities.