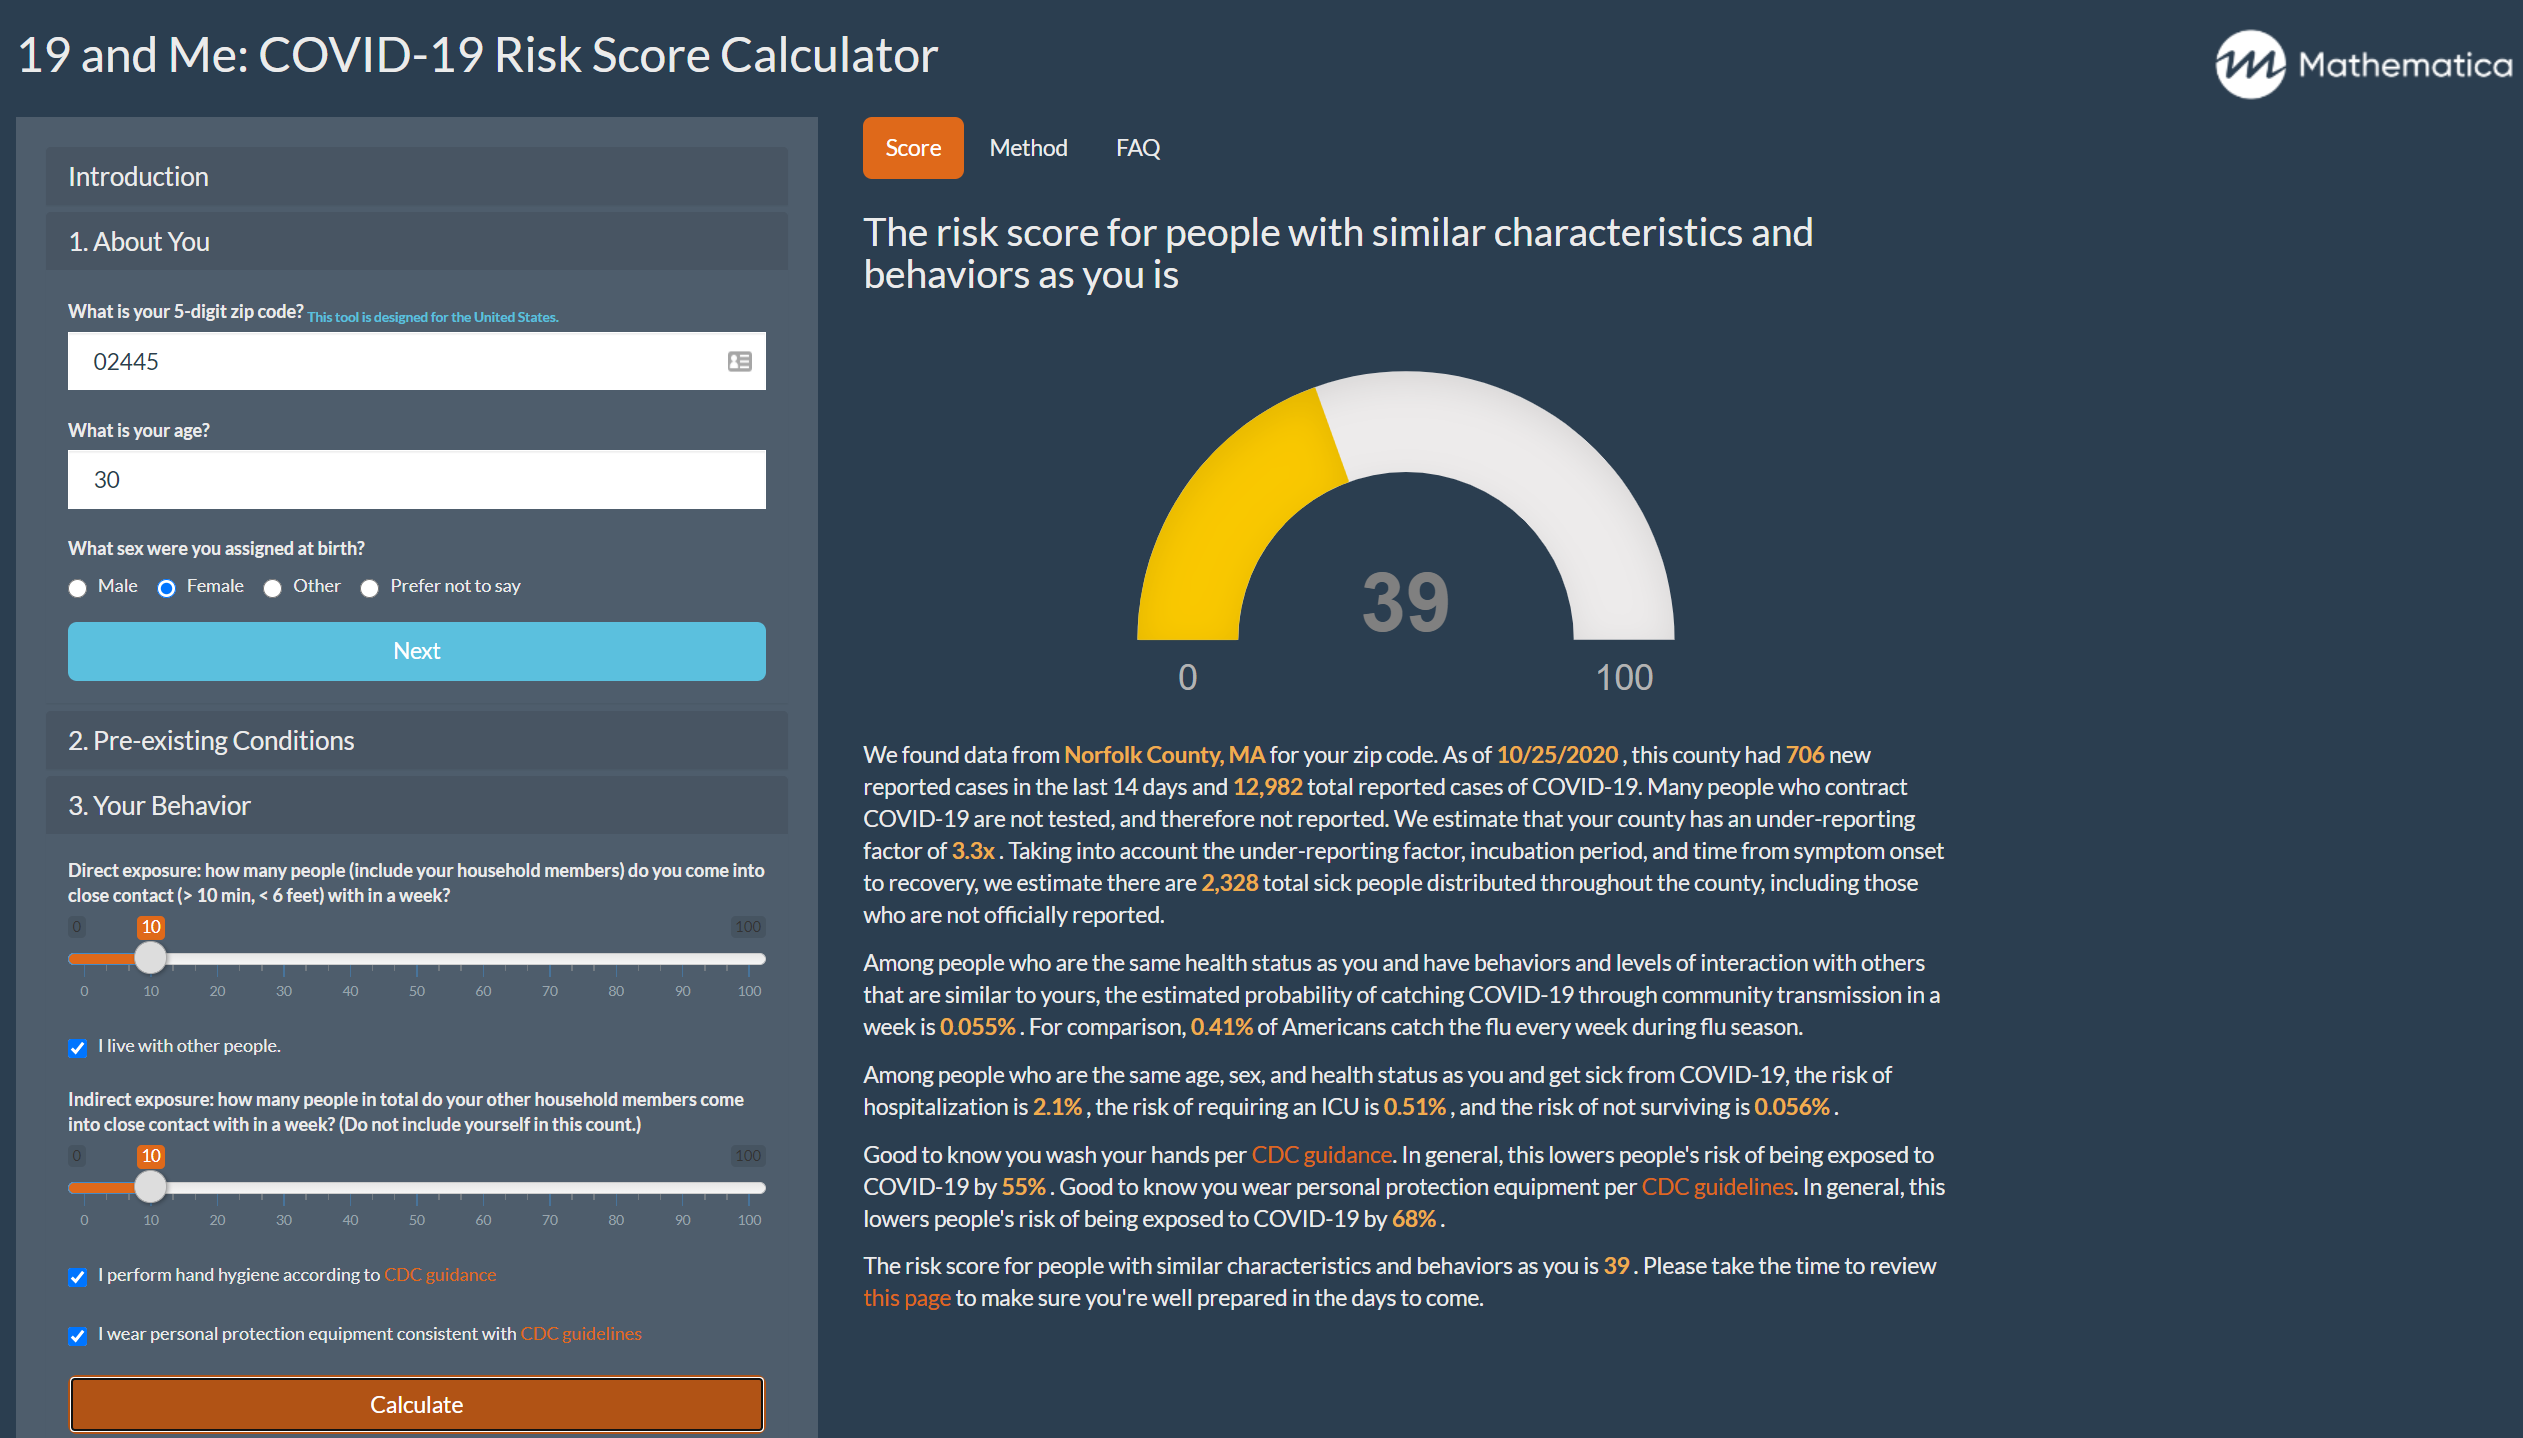
In early April, our team of data scientists, software developers, and epidemiologists at Mathematica created the 19 and Me app. The app synthesizes reported COVID-19 geographic case data and rapidly evolving scientific research to help people estimate how much risk the disease poses to them. Since the app launched, our understanding of how COVID-19 spreads and how it affects different sectors of society has improved significantly. The ways states measure and report data on COVID-19 cases and deaths have also become more comprehensive and accurate.
These changes to our understanding of the disease, how it is spread, and how it disproportionally affects different communities have led to important changes in the 19 and Me app. Here are a few major updates we’ve just made to the app and why.
We improved our estimates of underreporting.
Because of limited testing availability earlier in the pandemic and the existence of asymptomatic carriers, the actual number of infections is generally higher than the number of officially reported cases. We use the delay-adjusted case fatality rate (CFR), a methodology reported by Timothy Russell and his coauthors, to more accurately estimate the prevalence of COVID-19 in each U.S. county by taking into account unreported cases.
In earlier versions of the app, we calculated the CFR for each county as the proportion of cases in that county that have resulted in deaths and compared that to the best available estimates of infection fatality rate. For counties with few cases, this ratio of deaths to cases can be noisy and unreliable because the outcome of each case has a huge impact on the CFR. A simple solution to this problem would be to use the state CFR for small counties, but we can do better.
We now use an empirical Bayesian adjustment to “shrink” the county estimate toward the state estimate in a data-driven way.
This provides more stable estimates of the CFR, and thus more stable estimates of the number of unreported cases. In counties with many cases, the adjusted CFR will be essentially equal to the county-level rate. In counties with few or no cases, the adjusted rate will be closer to the state rate.
Bayesian adjustment improves the robustness of county-level case fatality rate estimates (Texas)
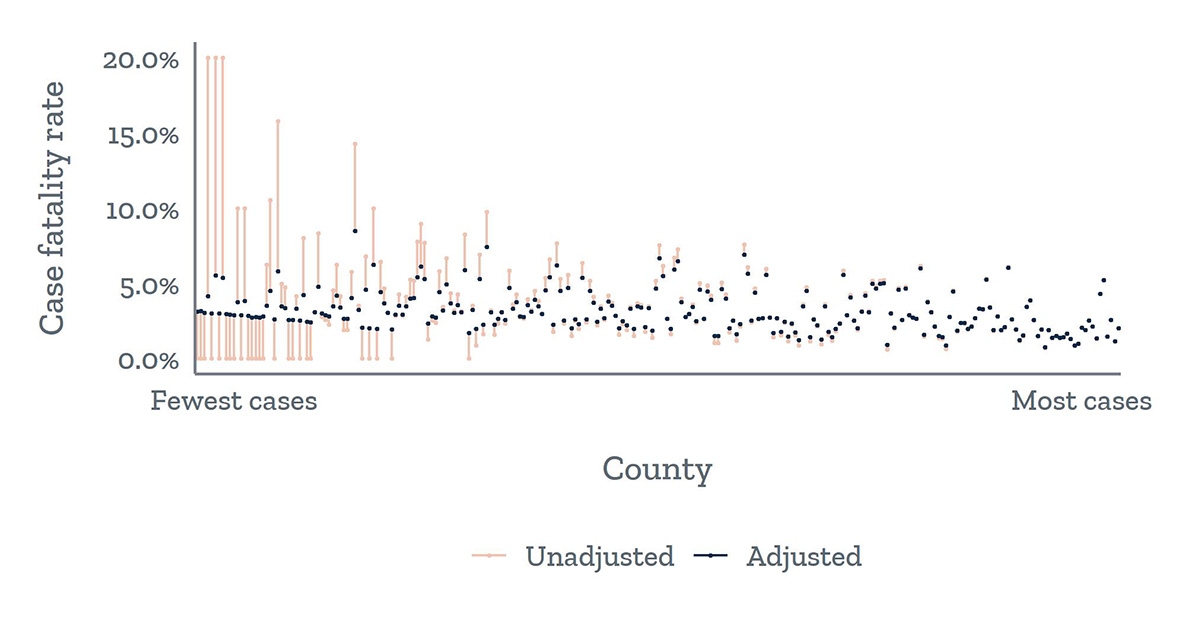
The unadjusted CFRs (red) for counties with fewer cases (left side of figure) vary widely, whereas the CFRs for counties with more cases fall in a smaller range. The adjustment of the CFR (black) reduces noise in the estimates for counties with fewer cases by shrinking them toward the state average, resulting in more stable estimates.
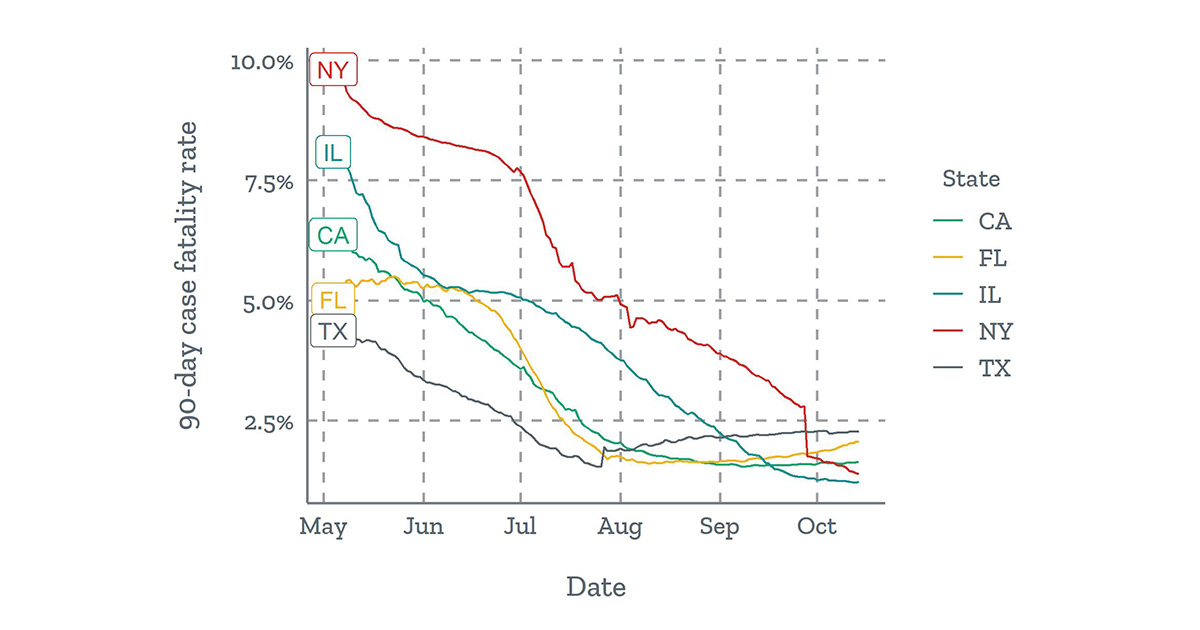
We now use a 90-day sliding window of cases and deaths to calculate a more current CFR.
The national CFR has decreased over time, in part because of greater testing capacity and a resulting higher proportion of reported cases. Using a 90-day sliding window gives a better estimate of the current level of underreporting in each county and thus a better estimate of the prevalence of COVD-19. When restricting to a 90-day window, the number of counties with few or no cases increases, so the Bayesian methodology we described above becomes even more important.
90-day case fatality rates have declined in many states
We switched our data source for national aggregates of county-level COVID-19 case and death data.
Several national-level aggregations of county-level COVID-19 case and death data are available. Each data source has its own data collection and reporting methods, which result in slight variations in numbers across sources. After conducting an in-depth comparison, we decided to switch from using New York Times (NYT) data to publicly available data from USAFacts because the latter has a more flexible data license.
Although the two data sources generally agree, USAFacts tends to report slightly fewer cumulative cases. This discrepancy stems from subtle differences in how the two sources attribute cases to counties. For example, the NYT includes federal and state prison inmates in the county-level counts and includes nonresidents in the Alaska counts, whereas USAFacts does not. The two data sources also have different geographic exceptions. For example, the NYT assigns all cases for the five boroughs of New York City (New York, Kings, Queens, Bronx, and Richmond counties) to one area called New York City, whereas USAFacts lists the counties separately. Because 19 and Me uses a user’s zip code to estimate local transmission risk, such geographic exceptions are important to accurately link COVID-19 case count to the local area.
No matter which data sources we use, we need to be aware that all data sources are subject to anomalies stemming from state and county-level reporting. For example, states began reporting probable deaths at different dates, usually all on a single day. This is relevant for 19 and Me because we use the number of deaths to calculate the CFR and the underreporting factor. In a future release, we will detect and repair such reporting anomalies in the case and death data using the methodology and software by the statistician Guannan Wang and her collaborators.
Time series data for the daily count of new deaths (left) and cumulative deaths (right) from New Jersey highlight the impact of a reporting anomaly in correctly interpreting trends.
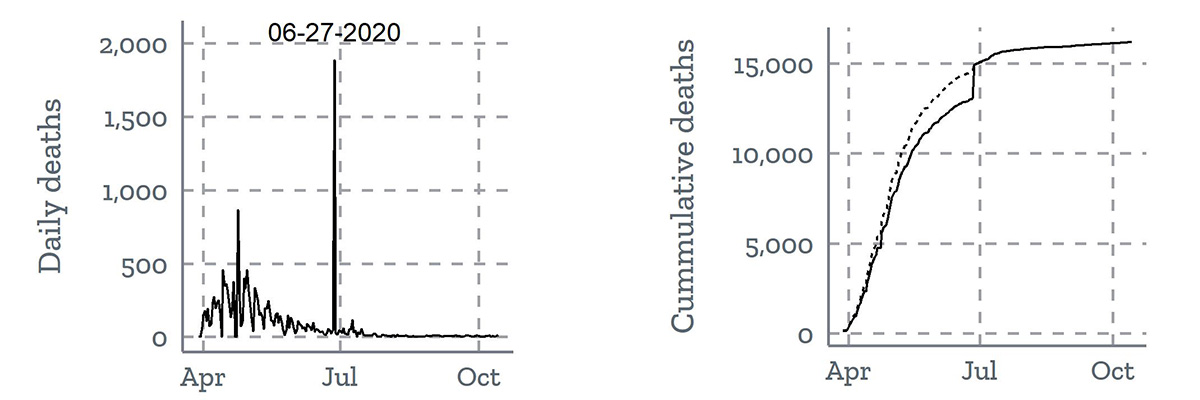
New Jersey reported almost 2,000 probable deaths from the first several months of the pandemic on June 27. In the left line graph, the daily reported deaths surge on June 27. In the right line graph, the dotted line corrects for the single-day surge in death count and estimates a more realistic trend line for how cumulative death counts grew from April to July. Modified from Wang et al.
We refined the probability of being placed in an intensive care unit (ICU).
In earlier versions of the app, users pointed out that sometimes the reported probability of being placed in an ICU was higher than the reported probability of being hospitalized, which was problematic because we would think that only a subset of people hospitalized because of COVID-19 would need intensive care. This issue stemmed from the incompatibility of methodologies from different studies. When studies report how much higher the risk of ICU placement is for someone who contracts COVID-19 and has a chronic condition (say heart disease), some studies adjust for other characteristics that are related to chronic conditions (such as age, sex, and other comorbidities), and some studies do not. In epidemiological terms, we call the former, “mutually adjusted effect estimates,” and the latter, “crude effect estimates.” Mutually adjusted effect estimates would allow us to accurately estimate the ICU risk, considering age, sex, and multiple conditions. However, we have yet to find a study or set of studies reporting mutually adjusted effect estimates for ICU risk for the range of chronic conditions we consider.
Previously, we used a combination of mutually adjusted effect estimates (for hospitalization and death) and crude effect estimates (for ICU), causing the probability of being placed in the ICU to be higher than the probability of being hospitalized with certain combinations of age, sex, and chronic conditions. We have addressed this problem in the latest release by calculating the probability of ICU placement as a product of the probability of hospitalization and the conditional probability of ICU placement, given hospitalization. This ensures that the probability of ICU placement will always be lower than the probability of hospitalization and provides a more realistic estimate of ICU risk.
Moving forward
Our team is enthusiastic about continuing to ensure that 19 and Me evolves as the pandemic progresses. Sometimes our improvements are motivated by advances in COVID-19 research and how it affects various groups. For example, the publication of a new study on differential probabilities of ICU admission for hospitalized patients with various comorbidities prompted us to update our estimates of ICU risk to be more compatible with our estimates of hospitalization risk. In other cases, the evolving dynamics of the pandemic motivate improvements in methodology; the implementation of a 90-day sliding window for the calculation of CFR was motivated by the understanding that, as the pandemic surpassed the six-month mark, the rate of underreporting in the early months of the pandemic no longer reflects rates of underreporting today. We also know the model can only be as good as the input data, so data curation is critical. We appreciate the continued engagement of users of our application and look forward to updating our methodology to better reflect the needs of our users.
The authors would like to thank Mathematica’s Emma Pendl-Robinson, Jennifer Starling, Margaret Luo, and Max Dulieu for their contributions in updating 19 and Me.