
The increasing frequency and intensity of natural disasters threaten communities across the country. People with disabilities are especially vulnerable to the impacts of disasters: they are two to four times more likely to be injured or killed in a disaster; more likely to be left behind in an evacuation; less likely to be able to access emergency shelters, services, and transportation systems; face discrimination when resources are scarce; and experience slower recovery.
To help policymakers understand the need to include people with disabilities in emergency disaster plans, Mathematica researchers used the power of data to answer the question, “Are people with disabilities living in areas at higher risk of natural disasters?”
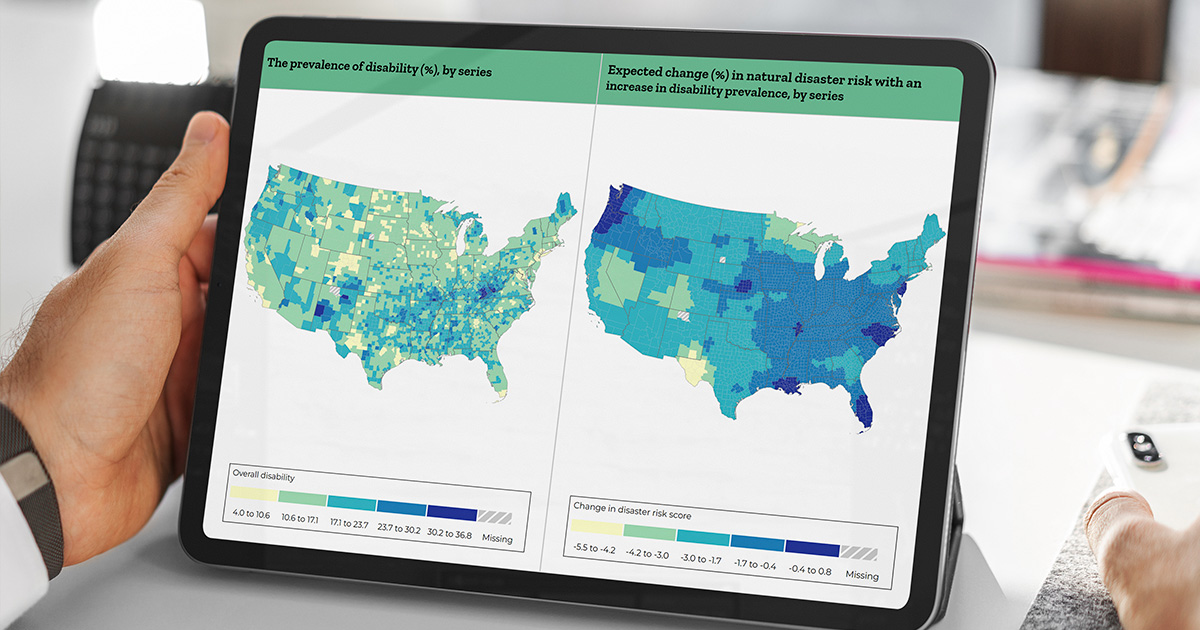
By using Mathematica’s newly developed interactive disability natural disaster maps, government officials and emergency planners can now see county-level variation in the proportion of residents with disabilities and the risk of natural disasters. The maps also dive into the demographic characteristics of people with disabilities to show how race, ethnicity, gender, age, and type of impairment affects their risk.
Some of the results of this work were surprising. The maps show that, in many cases, counties with relatively larger populations of residents with disabilities tend to be safer when it comes to natural disasters. Yet the maps also reveal that many counties at high risk still have a large number of residents with disabilities who need to be included in disaster planning, outreach, and recovery efforts. This includes about 4.4 million people with disabilities who live in the top 20 counties with the highest disaster risk.
“It is imperative that researchers and governments collect data that includes people with disabilities in order to build more equitable policies and programs,” said Amal Harrati, Mathematica researcher. “In the example of the disability natural disasters maps, we harnessed these data to raise awareness about the importance of disability-inclusive disaster planning and responses at the local level.”
County leaders focused on improving the accessibility of emergency preparedness and response programs can begin by reviewing recommendations and resources provided by federal agencies, such as the U.S. Department of Justice and the Centers for Disease Control and Prevention. These resources emphasize the importance of including people with disabilities in the planning process to ensure that their needs are understood and addressed in every phase of preparation, notification, response, and clean up.
The disability and natural disasters maps is one of eight research studies that Mathematica has conducted in partnership with the University of New Hampshire for the Rehabilitation Research and Training Center on Disability Statistics and Demographics (StatsRRTC). The StatsRRTC, funded by the National Institute on Disability, Independent Living, and Rehabilitation Research, seeks to narrow and bridge the divide between the producers and users of disability statistics so it can support better data collection, more accurate information, better decision making, more effective programs, and better lives for people with disabilities.
Mathematica researchers will share insights from several of these studies at the State-of-the-Science on Disability Statistics Conference on October 6–7, 2022. Join Amal Harrati, David Wittenburg, David Mann, Anna Hill, Yonatan Ben-Shalom, Jesse Chandler, Stacie Feldman, and other experts as they share new research and methods in disability statistics at this free event taking place online and in-person in Washington, DC.
Contact
-
Christal Stone Valenzano
cstone@mathematica-mpr.com
202-250-3520