The Agency for Healthcare Research and Quality (AHRQ) announced today that Mathematica is the grand prizewinner of the Agency’s Visualization Resources of Community-Level Social Determinants of Health Challenge for its data visualization tool. AHRQ Director Gopal Khanna, M.B.A, made the announcement at AcademyHealth’s annual Health Datapalooza conference in Washington, DC. Salish Research group was named the runner-up, and Rensselaer Polytechnic Institute was named the third-place finisher.
“While data offers us new ways of understanding our world, it can be challenging for communities to make sense of torrents of data streams. Innovations in data visualization, such as the data visualization tool, turn data into a guiding compass,” Khanna said. “Together, data, analytics, and visualization will help deliver 21st-century health care for patients and evidence-based health policy for communities.”
“It is truly an honor to be awarded this prize and recognition by AHRQ. We are thrilled to be able to leverage our data science and visualization skills to further our mission by providing an open-source tool to communities and developers," said Christopher Trenholm, senior vice president and managing director of Mathematica’ Health Unit. “Thanks to this recognition from AHRQ, we’re delighted this innovative instrument can help drive evidence-based policies and programs to improve health outcomes.”
AHRQ intends to use the data visualization innovations produced as part of the Social Determinants of Health Challenge competition as it considers new ways of presenting the Agency’s data sets and analytic tools to the public.
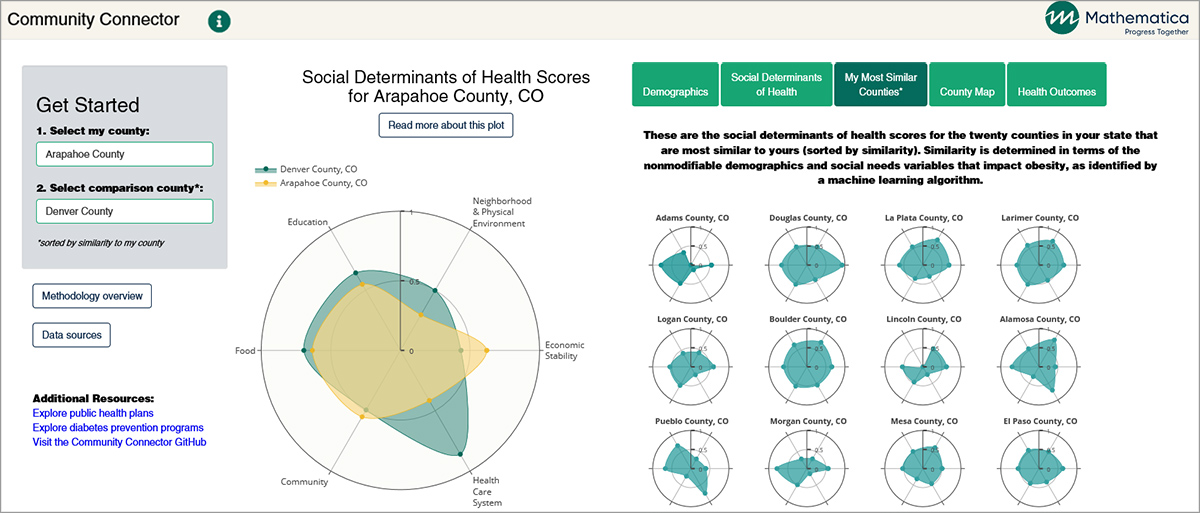
In a video, Data Analytics Developer Kelsey Skvoretz describes the competition and the data visualization tool. Designed for use by local government and public health officials, health care payers, researchers, and individual community members, the initial focus of the Community Connector app was to visualize the association between social determinants of health and the incidence of obesity, diabetes, and kidney disease in Colorado. By using a number of county-level health data sources, the app provides outcome-agnostic, county-level scores for six domains of social determinants of health. Using a machine-learning algorithm, the tool allows users to identify counties most similar to theirs, in terms of demographic and nonmodifiable social needs characteristics relevant to obesity, diabetes, and kidney disease. The app displays the distribution of health outcomes for all counties and the 20 counties most similar to a particular user for comparison.
The data visualization tool uses county-level data sources from the American Community Survey, the Robert Wood Johnson Foundation, the Centers for Disease Control and Prevention’s Diabetes Atlas, Area Health Resource Files, Opportunity Atlas, Walk Score, the Centers for Medicare & Medicaid Services, and the Colorado Department of Public Health and Environment.
Mathematica’s team comprised Kelsey Skvoretz, Margaret Luo, Evelyn Cody, Keri Calkins, Elena Saavedra Jimenez, Addison Larson, and Emma Pendl-Robinson.