
Rural hospitals are under increasing pressure to provide high quality care and access while maintaining financial viability. A quarter of rural hospitals nationwide are at a high risk of closure, and more than 130 rural hospitals have closed their doors since 2010, making it harder for residents in rural areas to access needed care. As rural hospitals seek to transition to a more sustainable business model, it is increasingly important to understand the role of Potentially Avoidable Utilization (PAU), which is defined as acute inpatient admissions and emergency department visits that can be reduced by timely primary and preventive care.
The geographic variation in PAU across the United States is well documented, but less is known about the proportion of rural hospital revenue attributable to PAU. Having better information about PAU is especially valuable because of the many challenges rural hospitals still face to remain open under the current fee-for-service payment system while they prepare to participate in value-based alternative payment models (such as the Direct Contracting Model and Community Health Access and Rural Transformation Model recently initiated by the Center for Medicare & Medicaid Innovation). Yet rural hospitals often lack data on their current PAU levels (or the ability to properly analyze data if they are accessible) and generally cannot compare their own PAU levels with those of other hospitals in the same geographic region. Without good data on PAU levels, rural hospitals cannot capitalize on opportunities to reduce them.
To help rural hospitals reduce PAU and continue to provide high quality care, we developed the Rural Health PAU Dashboard to measure the proportion of Medicare revenue from PAU at each rural hospital in the United States. The tool allows users to query PAU rates as measured by (1) admissions for ambulatory care sensitive conditions, (2) readmissions to the same hospital for any cause within 30 days of discharge, and (3) potentially avoidable emergency department visits for a single hospital, and it enables users to compare a hospital’s PAU rates with state benchmarks. Users can query the dashboard by state and hospital to review hospital-level PAU information.

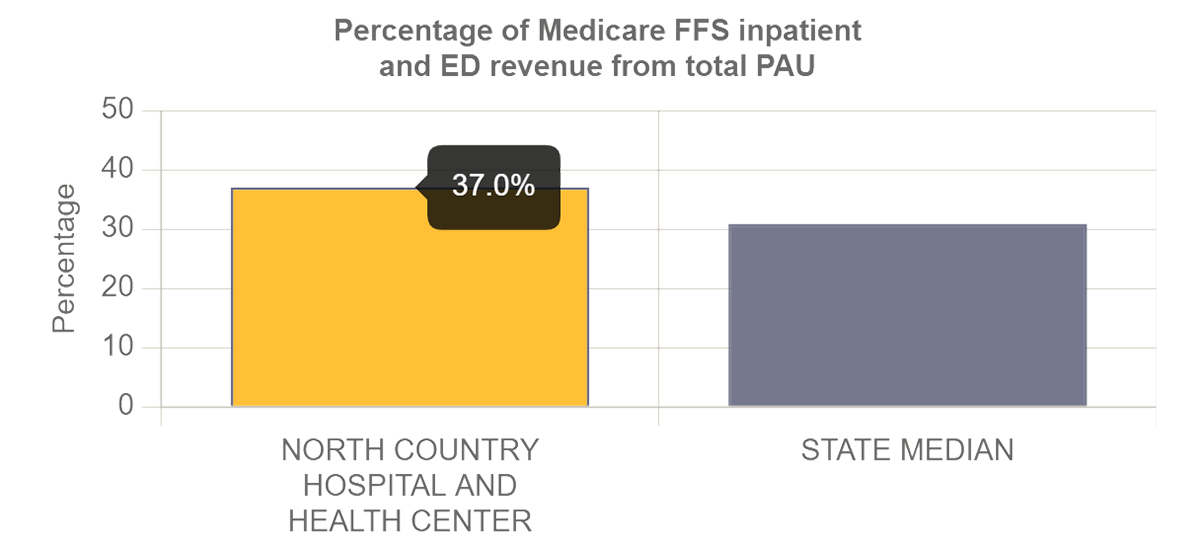
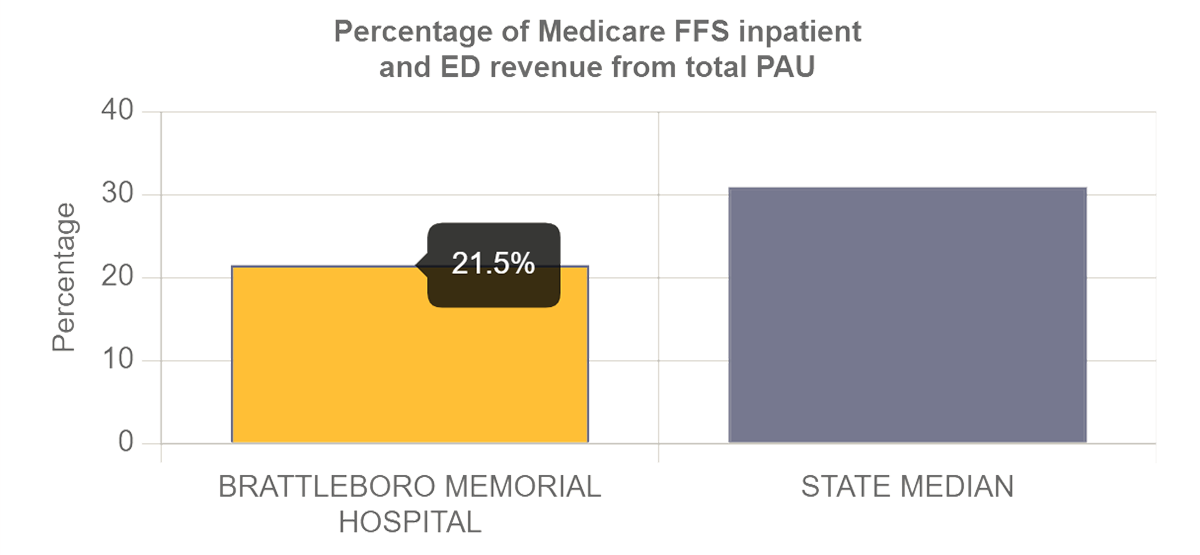
For state and local officials looking to support their rural health communities, the dashboard’s map view provides important context on the variation of PAU rates across rural hospitals in a state. Using actual output from the dashboard, the example above shows that the overall PAU rate for two hospitals located in northern and southern Vermont are notably different (37 percent versus 21 percent) and bracket the median PAU rate (31 percent) among all rural hospitals in the state. Users can also zoom in on the map to quickly identify rural hospitals within a sub-state area that have relatively high PAU rates compared with state benchmarks and thus greater opportunity for PAU reduction. As we discussed in a related blog, higher hospital PAU rates are associated with poorer population health among residents in the county in which the hospital is located. Reducing PAU rates in rural communities, therefore, appears to be a promising strategy to improve population health.
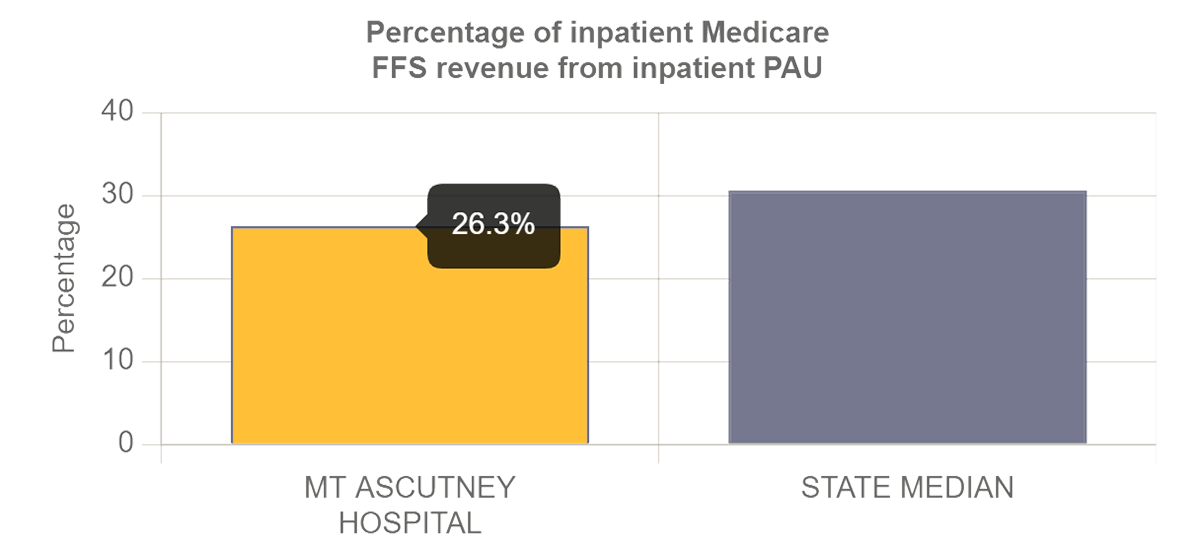
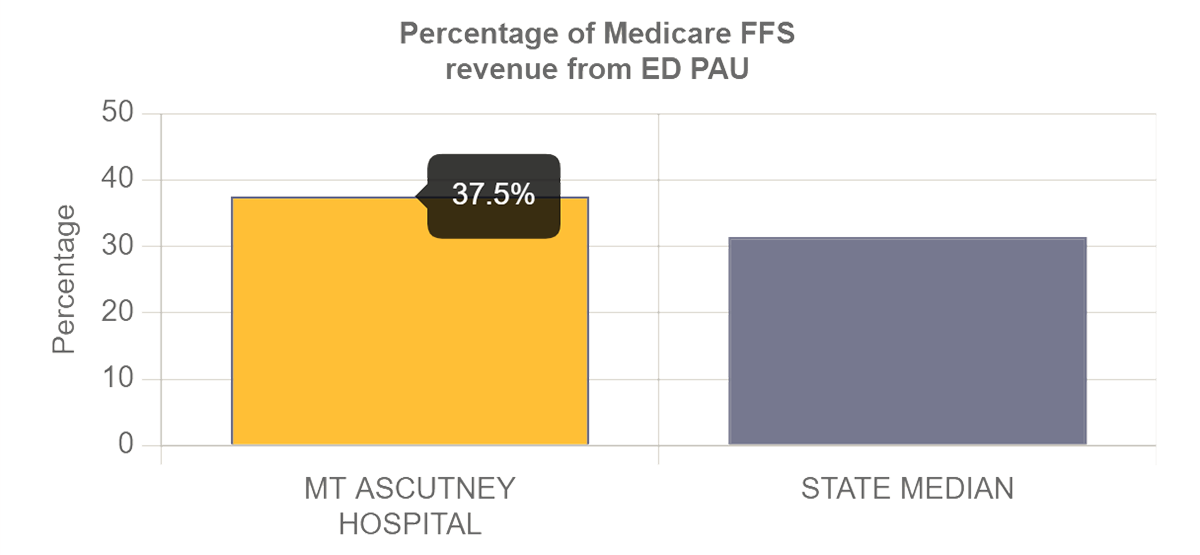
The detailed analysis view provides in-depth data on a hospital’s inpatient and outpatient revenue attributed to different types of PAU. These data can help inform individual hospitals on where they should invest resources to reduce their PAU. As shown in the two example charts below, some hospitals may have relatively higher PAU rates in the emergency department than in inpatient services (or vice versa). In those cases, the hospital might consider focusing on strategies to enhance patients’ access to primary care, for example, by providing after-hour care through its outpatient clinics. In the long term, such investments should help reduce emergency visits for non-emergent conditions, thus lowering cost of care and generating savings to hospitals under value-based payment arrangements.
To develop this dashboard, we calculated PAU statistics using data from 2019 Medicare Part A and Part B claims. We did not risk adjust the PAU measures, so although the PAU rates provide insight on the opportunity for an individual hospital to improve population health in its community, the rates are not indicators of the hospital’s quality performance relative to another hospital. For example, a hospital with a 40 percent PAU rate does not necessarily perform worse than a hospital with a 30 percent PAU rate because the difference in PAU rate could reflect differences in clinical and social risks of patient populations served by the two hospitals.
As the health care industry accelerates the shift from fee-for-service to value-based reimbursement methodologies, we hope that this dashboard helps rural hospitals better understand how reducing PAU could improve their financial health under value-based payment models.
We welcome feedback and questions on the dashboard and underlying data set. Please contact us at SGerovich@mathematica-mpr.com.