Last month, IES director Mark Schneider expressed excitement about learning more from the National Assessment of Educational Progress (NAEP) by applying artificial intelligence (AI) to micro-level data on students’ responses to individual test questions. We share the enthusiasm about learning more from NAEP—known as the Nation’s Report Card—and have developed ways to learn more today. Even without using AI, a lot more can be learned from the data that NAEP already reports: aggregated academic achievement results for states, districts, and demographic groups.
Existing reports of NAEP results ignore a considerable amount of useful information. Consider the latest NAEP Long-Term Trend results for 13-year-olds in reading, by race and ethnicity, which compare the first post-pandemic scores with the last pre-pandemic scores. On average across all 13-year-olds, NAEP reading scores declined by 4 points in the wake of the pandemic. Scores declined by 4 points for White students, 7 points for Black students, 4 points for Asian students, and 3 points for Hispanic students. But the official reports say that only the declines for White and Black students were “statistically significant”; scores for Asian and Hispanic students were reported as “not measurably different” than those groups’ last pre-pandemic reading scores. Unfortunately, relying exclusively on significance tests can lead us astray.
Reporting the subgroup results that way is technically correct but less helpful—and more confusing—than it could be. Based on the fact that declines for some of the groups were not statistically significant, the Washington Post concluded that reading declines were “split.” The Post made a classic but unsurprising mistake, assuming incorrectly that a nonsignificant result means there was no decline.
“Statistical significance” is harder to explain than it looks—which is why the American Statistical Association has been fighting an uphill battle for years to root out the all-too-common misinterpretation of significance tests. The technical meaning of statistical significance is quite different than what lay readers might reasonably expect the words to mean. In fact, a nonsignificant change means only this: If, hypothetically, there was no true change, random variation (luck of the draw) might produce the result shown by the data. A judgment of statistical significance only addresses this hypothetical question.
The good news is: we’re not stuck with indeterminacy in understanding the score changes for Asian and Hispanic students, because our interpretation of the change for each student subgroup can be usefully informed by the changes for other subgroups. The nation as a whole saw a decline in student reading scores. Other major racial/ethnic groups saw declines in student reading scores. Moreover, nearly all demographic groups and the nation as a whole had substantial declines in student math scores, too. A reader seeing all this information and armed with nothing more than common sense would likely conclude that the reading declines for Asian and Hispanic students—which were nearly identical to the nationwide decline—are likely to be real, just like the declines for White and Black students.
Happily, NAEP doesn’t have to rely on common sense. Bayesian statistical methods can systematically and rigorously incorporate all of that additional data. We’ve applied those methods, and we found—consistent with common sense—that Asian and Hispanic students as well as White and Black students most likely saw declines in reading scores. The non-significance for the Asian and Hispanic groups doesn’t mean their declines weren’t real; it only means that the numbers of tested students in those groups weren’t large enough to confidently detect differences of similar size. The fact that a change was technically nonsignificant doesn’t mean it was practically insignificant.
NAEP’s reliance on significance testing while ignoring contextual data led to considerable confusion last fall, when the “main NAEP” results were reported for all 50 states and 26 large urban school districts. The nationwide results from the main NAEP were as grim as those from the long-term trend, showing substantial declines in both reading and math in the wake of the pandemic. But with data from so many different states and districts to report, some of the nominal declines turned out not to be statistically significant. Following the lead of NAEP’s reporting, many journalists mistakenly interpreted nonsignificant declines as “holding steady”—and some of them went so far as to conclude that nonsignificant declines were “bright spots.” For the most part, they weren’t.
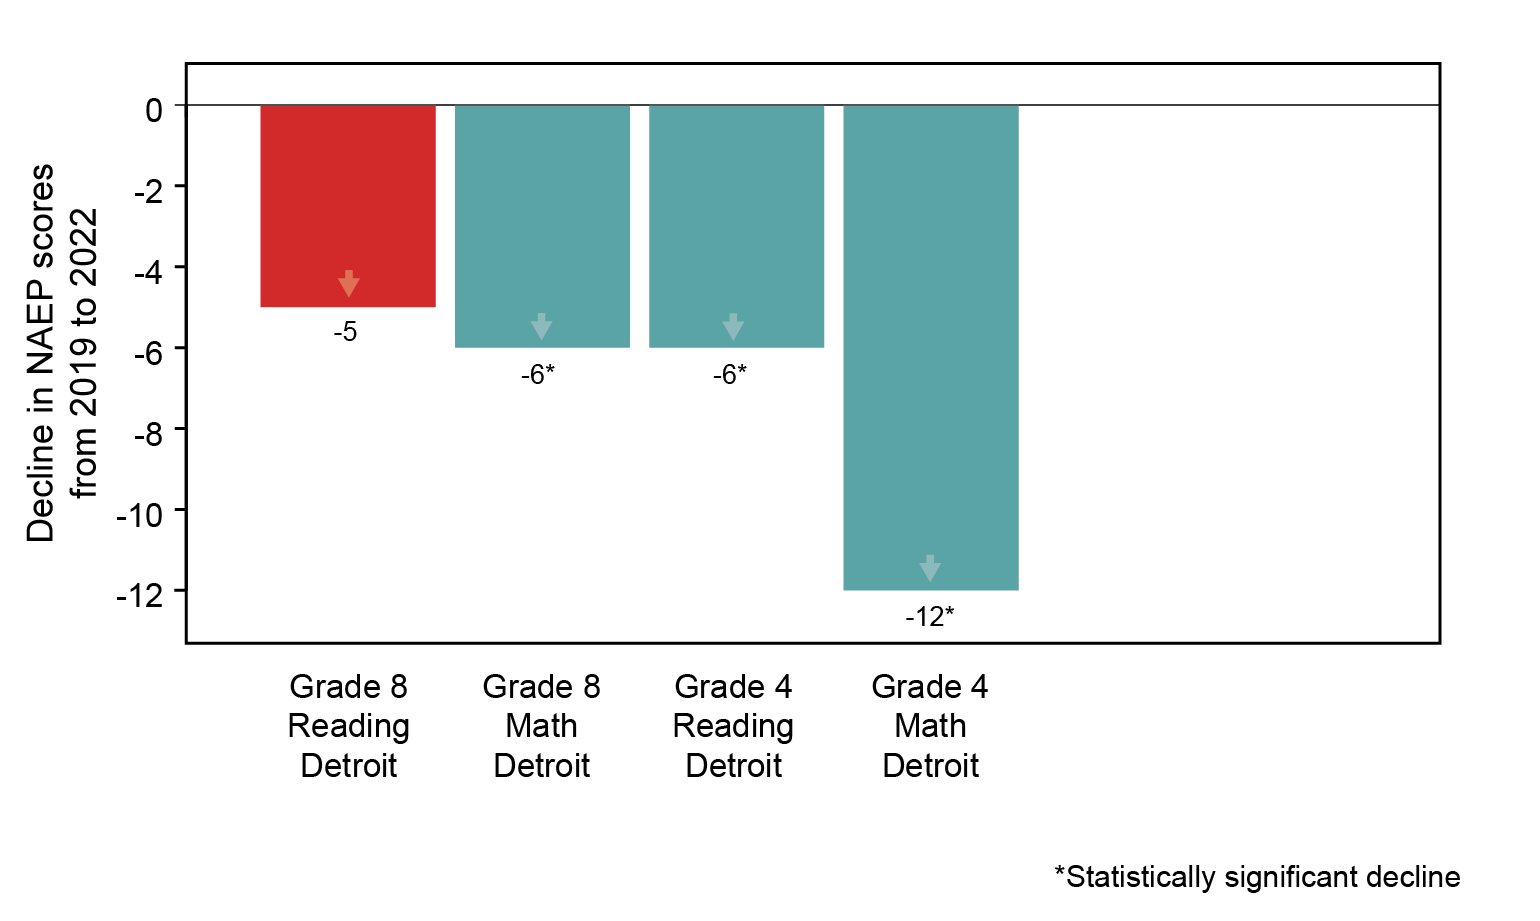
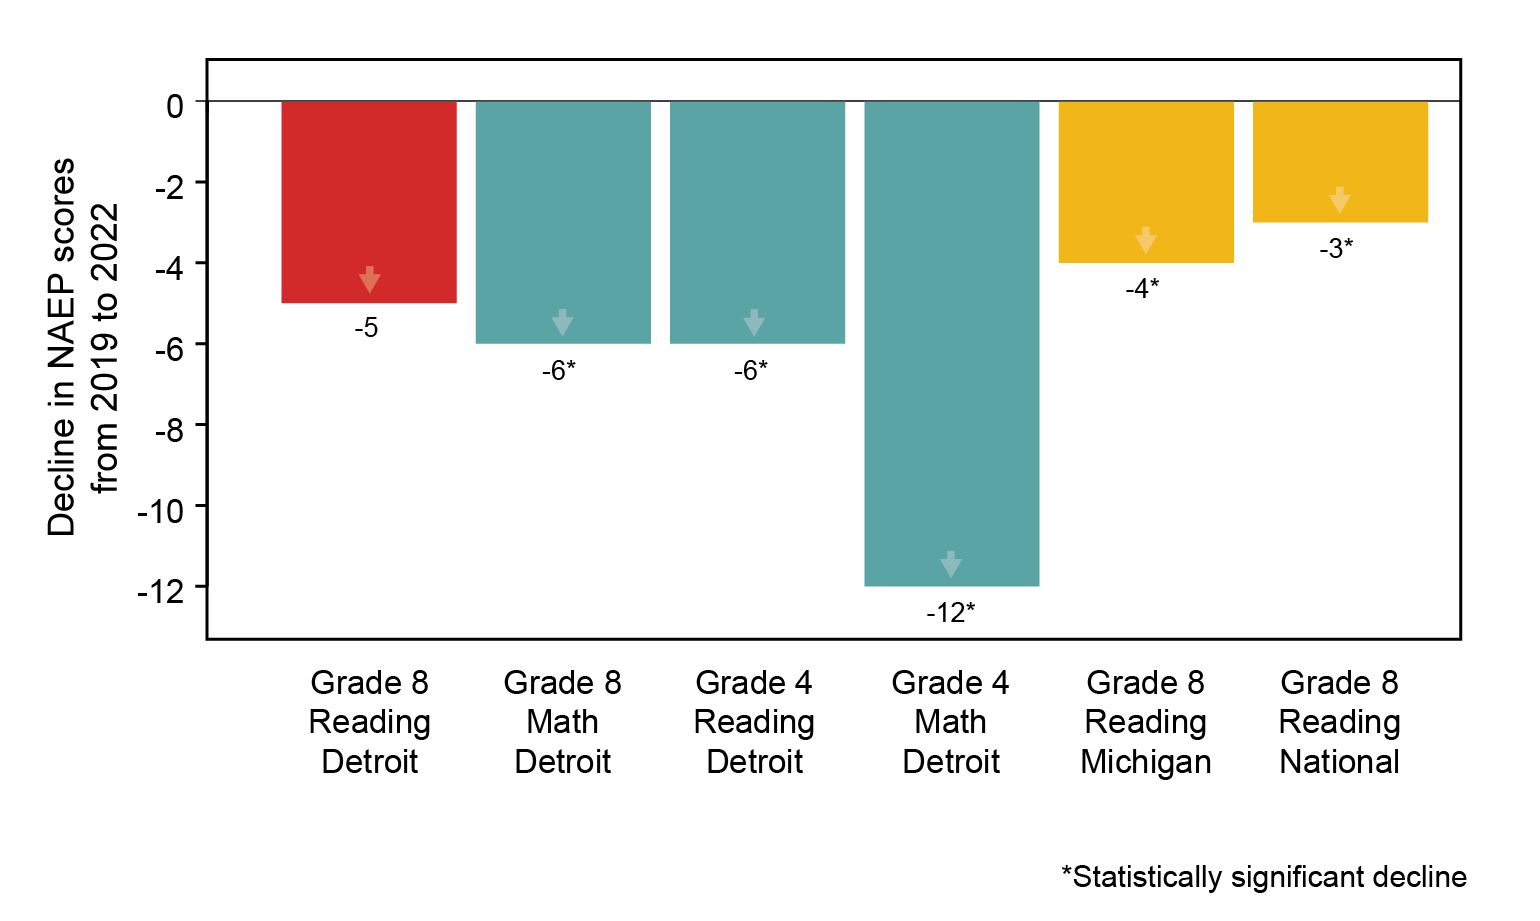
To appreciate this, consider an example of a “nonsignificant” score decline from among the geographically specific results on the main NAEP. Detroit’s 8th-grade reading scores were 5 points lower in 2022 (post-pandemic) than in 2019 (pre-pandemic). But this 5-point difference was not statistically significant. Should we therefore conclude that Detroit was “holding steady” in 8th-grade reading?
An accurate interpretation of Detroit’s 8th-grade reading results recognizes that there is additional information to consider. Detroit’s results from three other NAEP assessments are also available. Detroit’s 4th-grade reading scores declined by 6 points, its 8th-grade math scores declined by 6 points, and its 4th-grade math scores declined by 12 points. All of those declines were statistically significant. It would be reasonable to expect that the effects of the pandemic and school closures in Detroit would be felt in similar (though not identical) ways across grades and subjects.
Detroit’s NAEP results show declines across the board
That’s not all of the relevant additional information that’s available. We also know something about changes in 8th-grade reading scores in other places. If a global pandemic depressed 8th-grade reading scores in many other places, it would have been likely to do so in Detroit. Sure enough, 8th-grade reading scores declined by 4 points in Michigan and by 3 points nationally. Again, both of those declines were statistically significant.
Michigan and the nation showed (significant) declines similar to Detroit’s
A conclusion that Detroit “held steady” in 8th-grade reading ignores the mountain of evidence that scores declined systematically in Detroit and most everywhere else. Even if you ignore that mountain of evidence, you should interpret a finding of non-significance as implying only indeterminacy, not that there was no change.
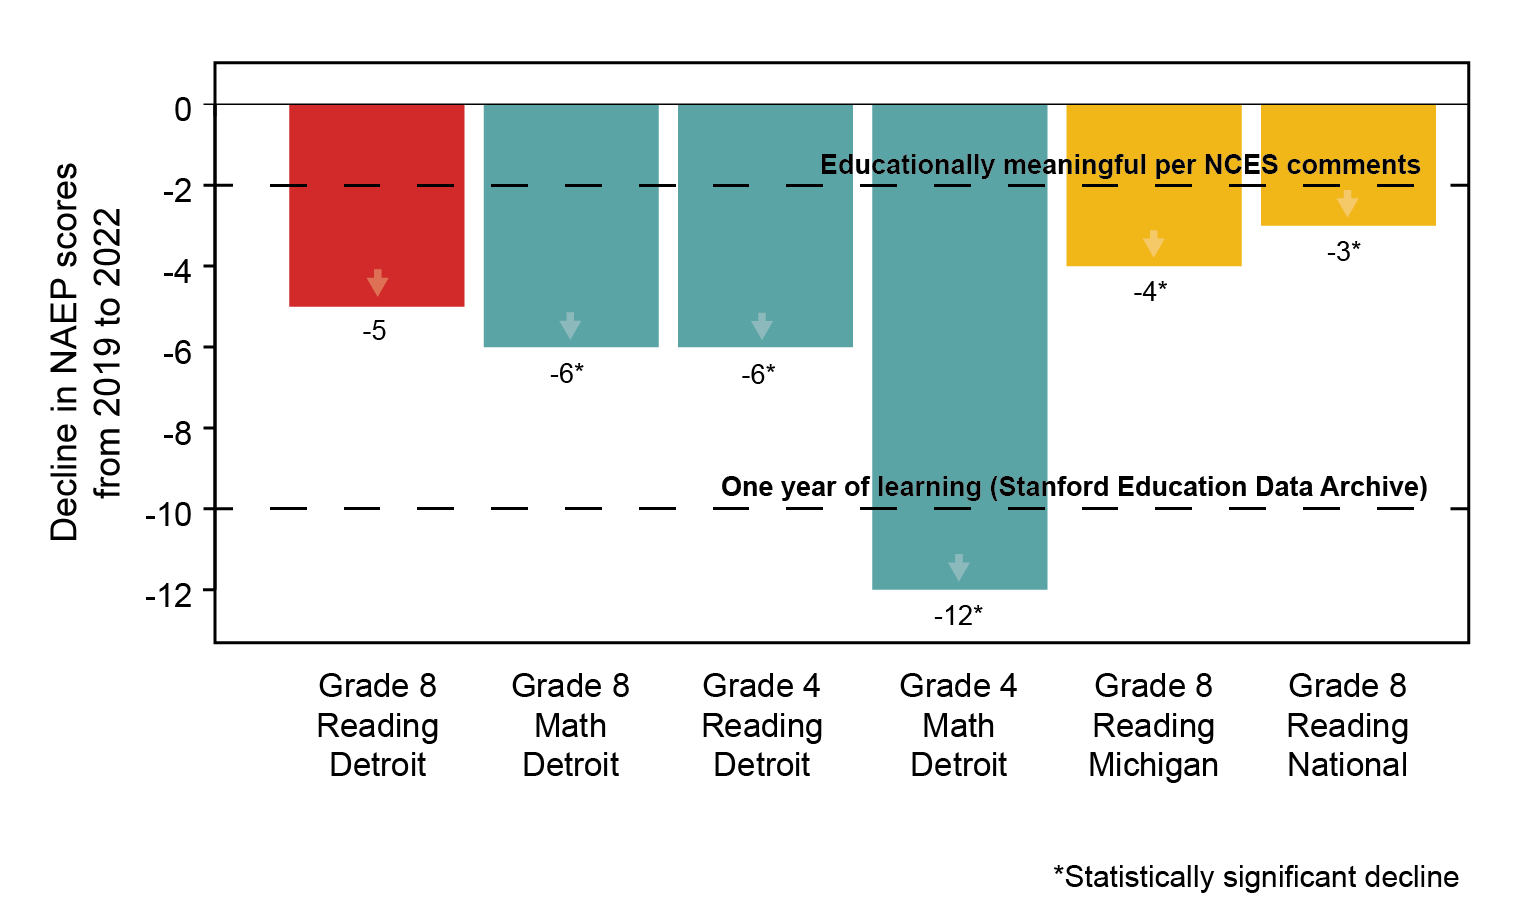
Moreover, an inappropriate fixation on statistical significance in NAEP sidelines critical discussions about the educational importance of changes in scores. What does a decline of 5 points on NAEP’s reading scale mean, anyway? The Commissioner of the National Center for Education Statistics has said that differences of as little as 1 or 2 points are educationally meaningful; scholars at Stanford and Harvard have done some creative work that suggests that a year of learning is approximately equivalent to 10 points on NAEP scales. By either of those benchmarks, Detroit’s 5-point decline in 8th-grade reading scores would be large.
Detroit’s changes in NAEP scores relative to external benchmarks show educationally meaningful—even if not statistically significant—learning loss
The general story is clear: Students in all racial/ethnic groups and nearly every state and city experienced educationally meaningful declines exceeding one-quarter of a year of learning in both reading and math. We report results for every state and participating district here. In some cases, the results highlight previous errors in reporting. For example, official NAEP reports concluded that “Average scores for fourth-grade reading held steady in a majority of the participating districts,” but our re-analysis shows that nearly all nonsignificant changes likely involved real declines, most of which were educationally meaningful. The latest reading declines were not “split” across demographic groups, as reported by the Washington Post, but consistent and educationally meaningful for every racial and ethnic group.
Even so, it is important to recognize that nothing inherent in Bayesian analysis makes the general story more negative. If student achievement across the country bounces back and the next round of NAEP scores shows improvement, researchers can use Bayesian analysis to fully recognize the scope of improvement across cities, states, and demographic groups. We hope IES will be ready by then to learn more from NAEP data.