The rate of fatal drug overdoses in the United States more than doubled between 1999 and 2015, with deaths from opioid overdose more than tripling. As the largest payer for substance use disorder (SUD) treatment, the Centers for Medicare and Medicaid Services (CMS) recognized its own critical role in helping states expand access to SUD and opioid use disorder (OUD) treatment and took action by encouraging states to implement well-designed and monitored section 1115 demonstrations.
In 2015, CMS released a letter to state Medicaid directors encouraging states to pursue five-year section 1115 SUD demonstrations. These demonstrations, named after the provision in the Social Security Act that authorizes their use, give states the flexibility to test new program designs that may serve Medicaid populations better. In 2017, CMS released an updated state Medicaid director letter that outlined expectations for these demonstrations, including specific milestones and goals. The 2017 letter also introduced a new strategy for supporting states in monitoring and evaluating their demonstrations to ensure they are working as designed and recognizing promising performance more quickly.
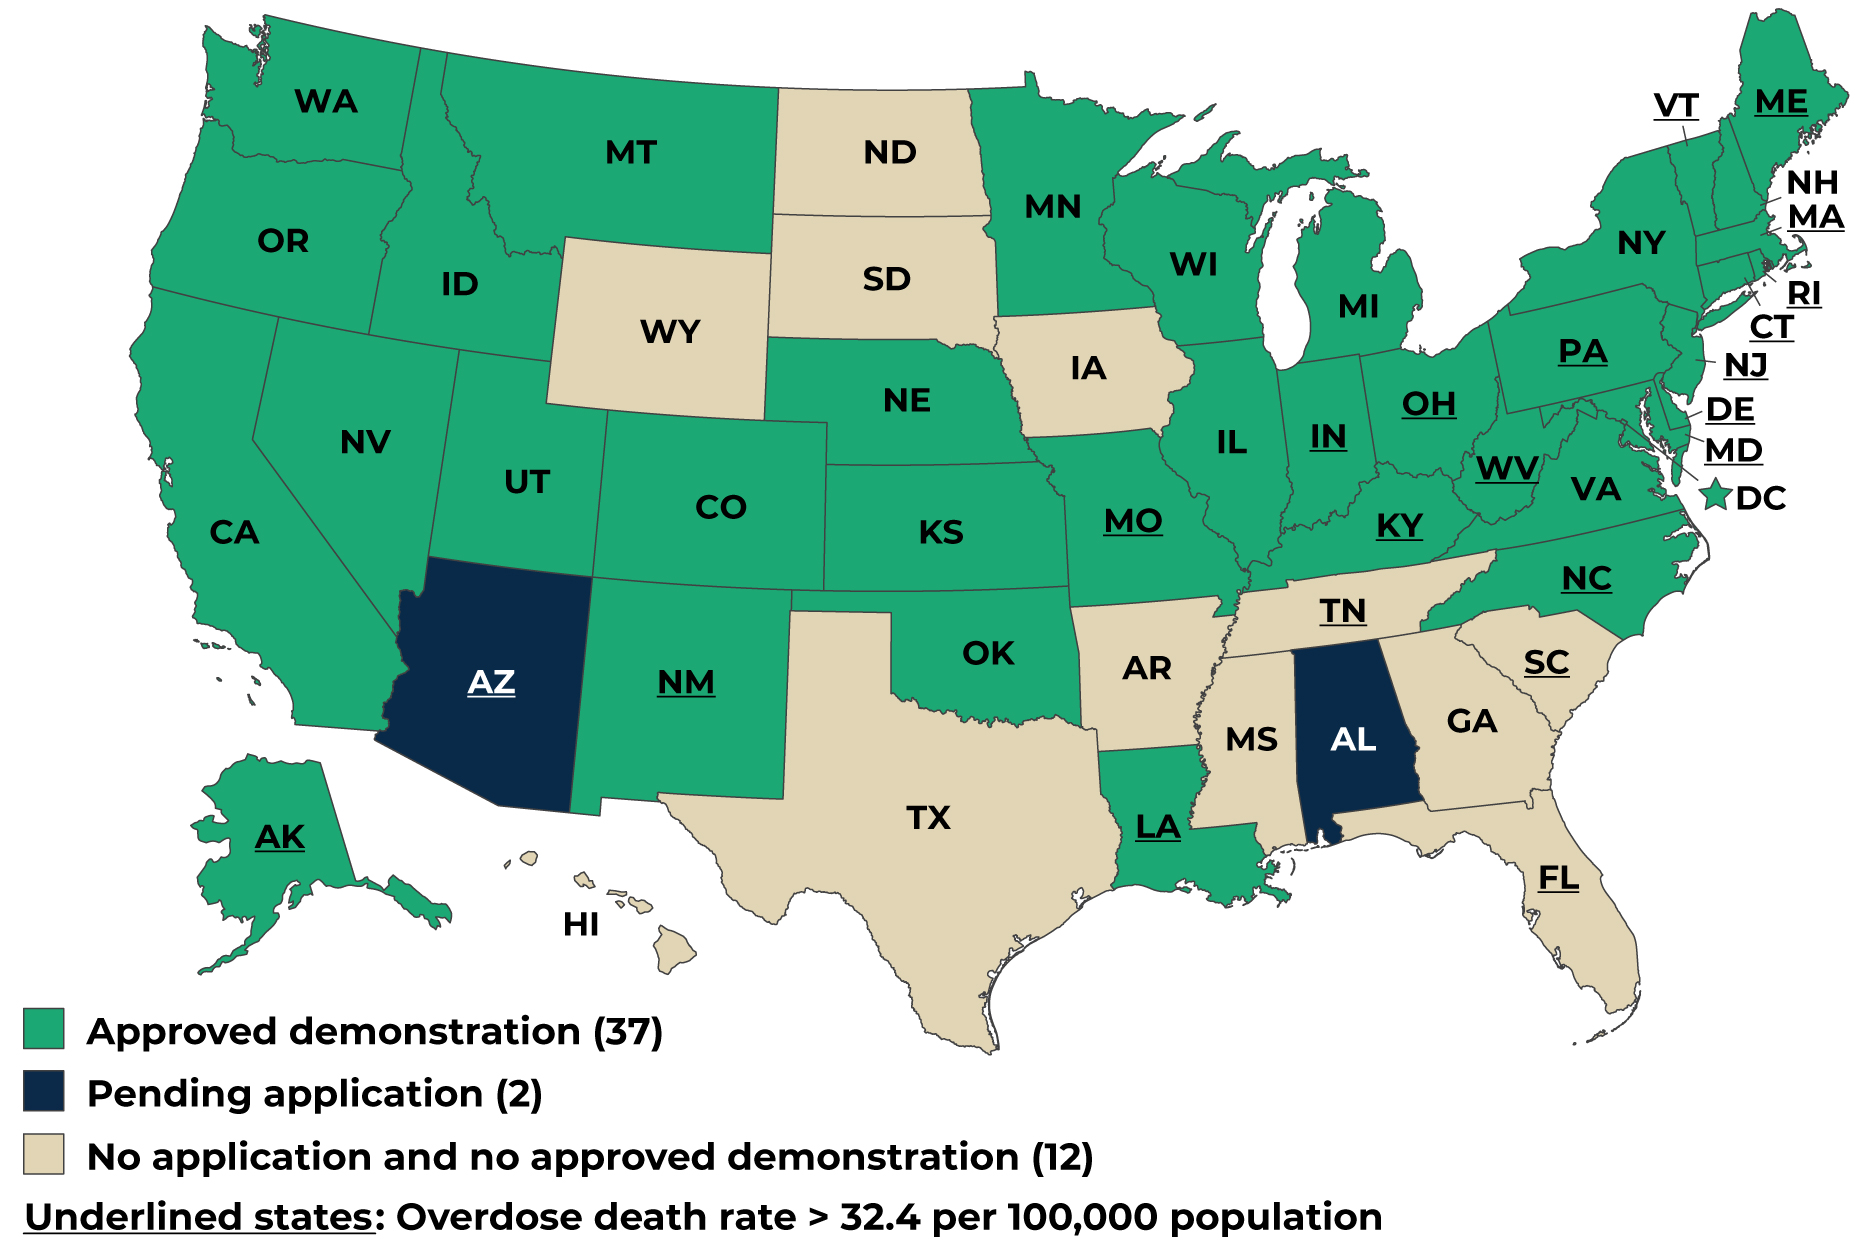
States have responded enthusiastically to the 1115 SUD demonstration opportunity since its inception, with 37 of them approved for a demonstration as of January 2024. Moreover, the approved or pending applications for an 1115 SUD demonstration cover nearly two-thirds of people eligible for Medicaid and represent the majority of states with rates of drug overdose deaths that exceed the national average. Given this historic level of state participation, the enhanced expectations for monitoring and evaluation as set forth in the 2017 letter are an exciting and unique opportunity to build the base of evidence for addressing SUD among Medicaid beneficiaries.
Mathematica has worked closely with CMS to identify and maintain a set of metrics that assess state demonstration activities and their related outcomes, along with standardized reporting templates that support data quality and comparability across states.
As of January 2024, 36 of the 37 states with an approved 1115 SUD demonstration have begun using the standardized monitoring and evaluation tools.

Source: Approved and pending applications obtained from State Waivers List | Medicaid as of January 2024. Drug overdose death rates for 2021 obtained from the National Center for Health Statistics.
Note: States whose abbreviations are underlined had drug overdose death rates higher than the national average in 2021 (>32.4 per 100,000 population).
Through the data states submit, CMS and other stakeholders can understand each state’s progress toward the demonstration milestones, help clarify which strategies are successful, and identify when course correction or additional support from CMS may be necessary. Mathematica has been analyzing state monitoring data to examine performance over time and across states, bolstering CMS’s ability to monitor performance and inform policy decisions.
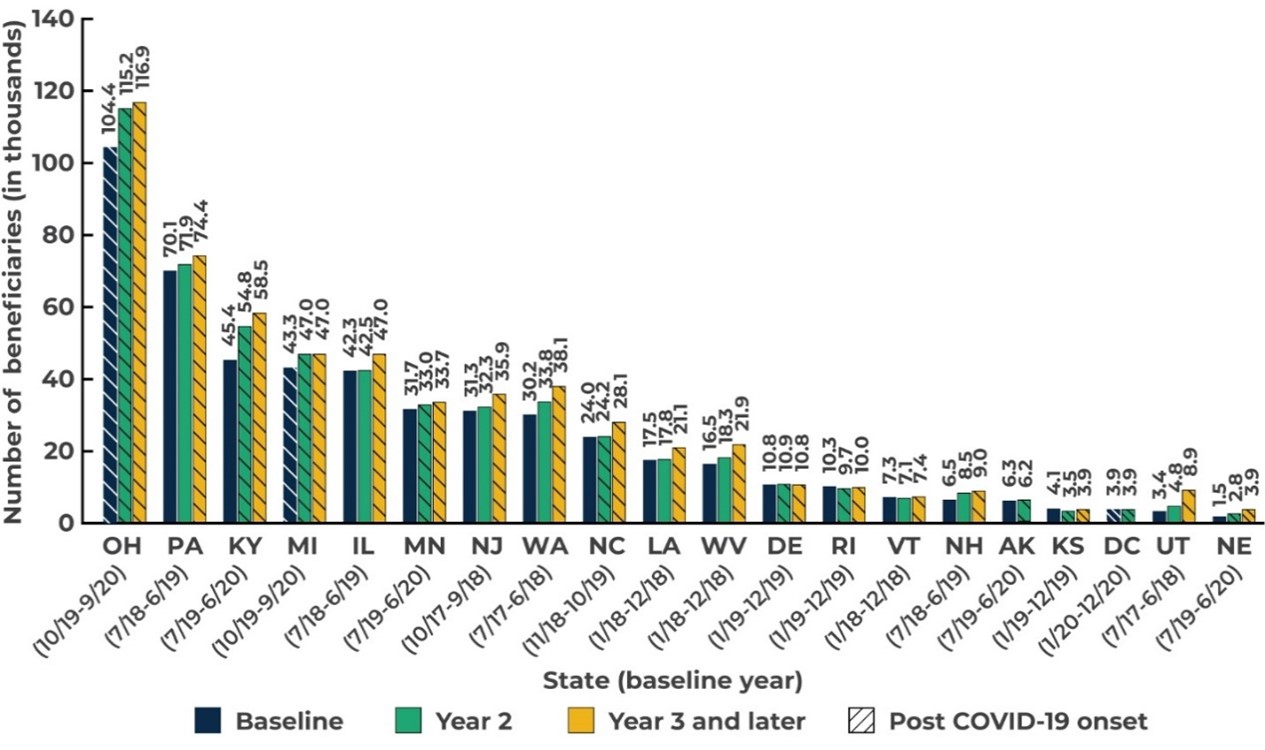
Initial findings based on Mathematica’s analysis of states’ monitoring reports submitted through June 1, 2022 (representing monitoring data from 20 states), suggest that implementing 1115 SUD demonstrations may have encouraged use of SUD treatment and discouraged overuse of residential services.
The average number of beneficiaries using any SUD treatment per month increased between the baseline demonstration year and the most recent reported demonstration year in 15 of 20 states reporting.

Source: Medicaid Section 1115 SUD Monitoring Report Workbooks submitted through June 1, 2022.
Across states, the demonstrations were associated with a significant 5.7 percent increase in the number of beneficiaries using any SUD treatment between the baseline year and Demonstration Year 2, and a significant 17.1 percent increase between the baseline year and Demonstration Year 3 and later. For beneficiaries with documented OUD, the demonstrations were also associated with a significant increase in the share who received medication-assisted therapy (MAT) between the baseline year and Demonstration Year 3 or later. Although the demonstration provided new coverage for residential services, the share of treatment users who receive these services did not change significantly—a positive outcome for those concerned about overuse of residential care.
In addition, the number of individuals continuously receiving pharmacotherapy for OUD for at least six months increased between calendar years 2019 and 2020 in all 14 states reporting this measure. According to guidelines for treating OUD, treatment with the most commonly prescribed medications (methadone and buprenorphine) for less than 90 days provides little benefit, and a substantially longer span of treatment is associated with more positive long-term outcomes. Increases in the number of beneficiaries receiving continuous pharmacotherapy are likely associated with more beneficiaries having better long-term outcomes.
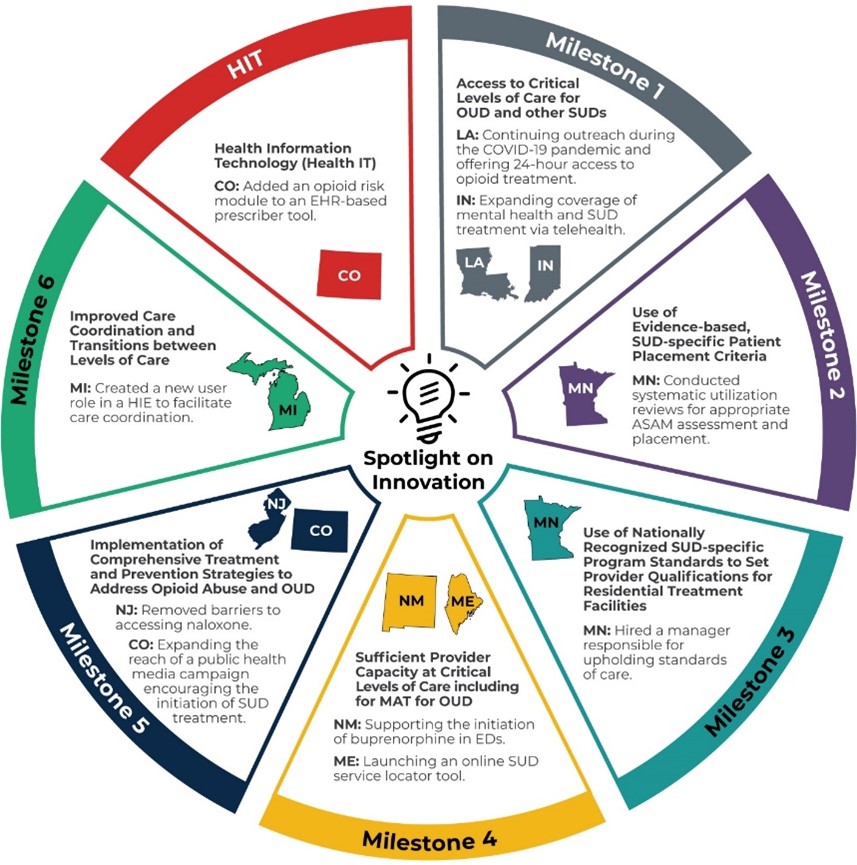
States also reported using innovative strategies to achieve the demonstration milestones.

Source: Qualitative data reported by states in monitoring reports submitted from June 2, 2021, through June 1, 2022. Activities were identified in monitoring reports. Other sources were used to understand the activities, if needed.
ASAM = American Society of Addiction Medicine; ED = emergency department; MAT = medication-assisted therapy
The need for 1115 SUD demonstrations persists: despite an encouraging decrease in opioid prescriptions coinciding with expanded access to MAT for OUD, the rate of drug-involved overdose deaths in the United States continued to rise during the COVID-19 public health emergency, due in large part to an increase in deaths involving illicit fentanyl. The crisis is daunting, yet the scope of states’ collective efforts to address it and CMS’s investments in building an evidence base about impactful policy solutions are both promising. Additional monitoring and evaluation data submitted by demonstration states will enhance our understanding of states’ progress toward demonstration milestones and identify opportunities to increase the reach of innovative or promising strategies for preventing and treating SUD. Stemming the rise in overdose deaths is a moral and policy imperative that calls for evidence-backed solutions, and we are proud to contribute to identifying what works.


