Policymakers and practitioners often want to understand how students are progressing through their education and beyond—and how well schools are serving them—to make informed decisions about how to best meet students’ needs. Yet these efforts are hampered by the narrow set of measures available to them. This challenge came to a head with the pandemic. Although drops in math and reading test scores have been thoroughly analyzed, we have less data about how students in grades that aren’t typically tested, as well as those with different learning needs, fared. And we know even less about how students were affected in other ways, such as their readiness to start kindergarten, preparation for college, or attainment of skills to succeed in the workforce.
To provide policymakers and practitioners with the information they need to best support students, we must identify the most critical questions for driving action and ensure our pre-K-to-workforce data systems are designed to answer them.
Local initiatives show the promise of linked data systems designed to answer a community’s questions
Take the example of Hamilton County, Tennessee. Since 2004, the Public Education Foundation has managed a database that links student data from multiple sources to provide a holistic picture of the county’s students as they move from kindergarten through college. One of the community’s most pressing questions was whether students were on track for high school graduation and success in college. To answer this question, PEF had to establish data-sharing agreements with Hamilton County Schools, the University of Tennessee at Chattanooga, and Chattanooga State Community College, and obtain student data from the National Student Clearinghouse. These efforts allowed the development of dashboards that school counselors now use to know which students are on track to graduate high school and succeed in college and proactively support them well before their senior year. But this is just one community. Through state longitudinal data systems, state governments can help ensure all communities have access to the linked data needed to support students as they transition from pre-K to the workforce.
A new framework offers guidance for identifying essential questions and the data needed to answer them
In the Education-to-Workforce Indicator Framework (E-W Framework), we offer 20 essential questions every state longitudinal data system should be able to answer to provide actionable insights on how people are progressing on their educational and career journeys, and what they need to thrive. Along with these questions, we recommend a common set of indicators and metrics that longitudinal data systems should capture to provide meaningful answers. The framework was developed by staff from Mathematica, Mirror Group, and the Bill & Melinda Gates Foundation with input from experts from over 15 national and community organizations and insights drawn from more than 40 existing data frameworks. It was designed to promote data collection and use to advance educational and economic opportunity for all. Some of the framework’s essential questions include:
- Do students and families have access to adequate public supports and neighborhood conditions to enable them to succeed academically and in the workforce?
- Do students have access to quality school environments?
- Are students demonstrating satisfactory academic progress, consistent attendance, and positive behavior to be considered on track, from early grades into high school?
- Are students graduating from high school on time and successfully transitioning into further education, training, or employment?
- Are students gaining access to quality jobs that offer economic mobility and security after high school or postsecondary training and education?
The E-W Framework organizes indicators by type, domain, and sector. The framework offers three types of indicators: (1) outcomes and milestones, (2) E-W system conditions, and (3) adjacent system conditions. System conditions refer to factors that can support—or hinder—students’ success. For example, in addition to indicators of student learning, the framework recommends measuring teaching effectiveness, student expenditures, school climate, access to technology, food security, and other factors that need to be in place for students to learn. The indicators cover the domains of academic progress and completion; physical, mental, and social well-being; and career readiness and economic success, all of which matter for supporting people’s journeys toward economic mobility and security. And they span the pre-K, K–12, postsecondary, and workforce sectors to capture the entire journey, including the transitions that occur as students move from one sector to the next. Together, this system of indicators provides the data needed to answer policymakers and practitioners’ essential questions.
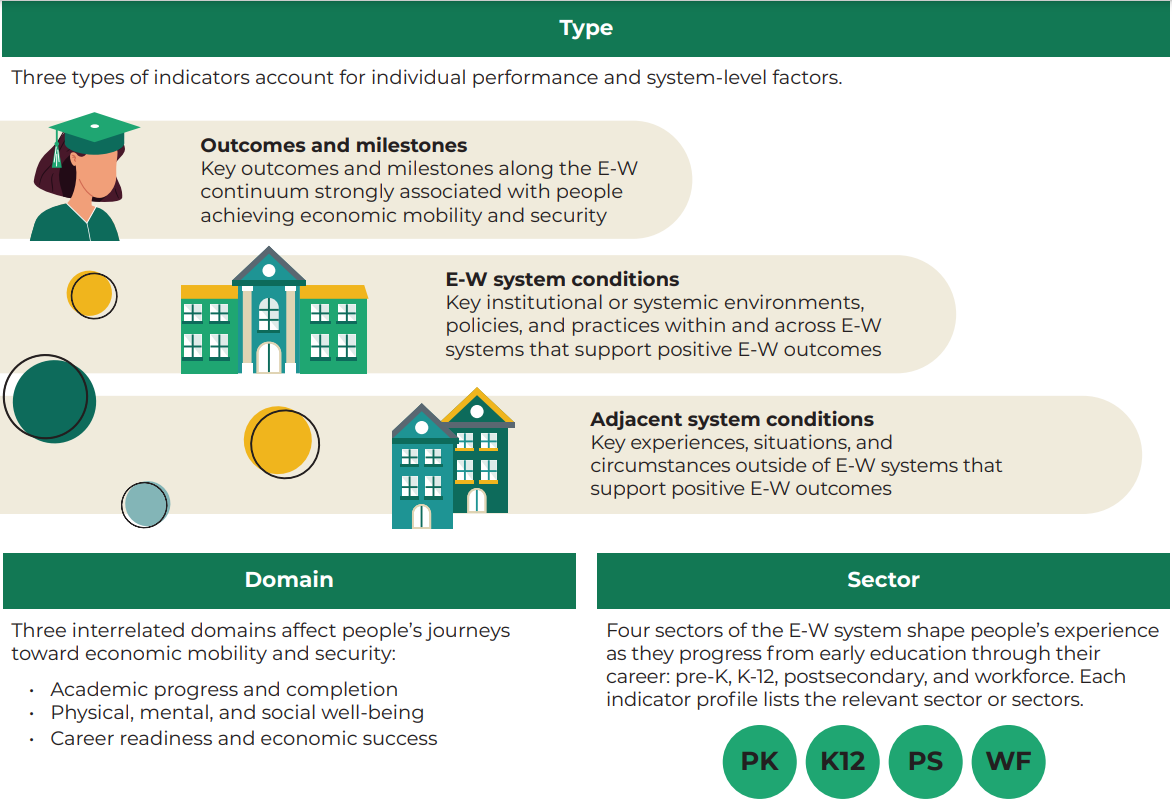
Indicators by Type, Domain, and Sector
This image depicts and defines the three categories of indicators included in the framework: (1) outcomes and milestones, (2) E-W system conditions, and (3) adjacent system conditions. It also defines the domains that make up the indicators and the sectors that may collect data on these indicators. Download our Indicators at a Glance resource to learn more.
The pandemic exacerbated the need for better data but also offered an opportunity to refine our data systems
Currently, only 19 states have a longitudinal data system that connects data from the pre-K, K–12, postsecondary, and workforce sectors—and all states could work toward ensuring policymakers and practitioners have better access to the data they need to take action. As the Data Quality Campaign highlighted in a recent brief, COVID-19 pandemic relief bills provided more than $263 billion in education-oriented funds, and other funding sources have become available for states to modernize their data systems. Indeed, 29 states have proposed using federal funds from the Elementary and Secondary School Emergency Relief Fund to link or improve their data systems.
But we must be intentional about how these systems are designed to ensure they can answer the essential questions that too often go unanswered. Our Essential Questions Guide provides a step-by-step resource for using this approach to help decision makers prioritize what matters most to measure, assess the state of education and workforce data systems, and plan for alignment across data systems. Leading with essential questions not only helps collect meaningful data but puts those data to good use.
New Mexico and California offer promising examples of this approach in action. In partnership with other states, New Mexico led the development of “killer questions,” which refer to key policy questions that come up repeatedly, along with a template to identify the corresponding data needed to answer them and drive action. The state is soon to launch a new education and workforce data system designed around these questions. In California, a new Cradle-to-Career data system is being designed to answer six essential inquiry areas. California modeled these on a Data Quality Campaign brief on critical policy questions, which highlights New Mexico’s story.
Our data systems should seek to answer questions rather than drive—or limit—what we ask. Recent efforts to modernize state longitudinal data systems and address the disparities exacerbated by the pandemic have the potential to improve our shared understanding of how students are progressing from pre-K into the workforce and how to best support them on their journey—unleashing the true power of data for achieving greater equity.