

For the past two years, in recognition of the educational disruptions of the COVID-19 pandemic, the U.S. Department of Education (ED) waived key requirements of the Every Student Succeeds Act related to schools’ accountability for performance. State assessments were canceled across the country in 2020; assessments (mostly) returned in 2021, but states were not required to use them to identify low-performing schools. But 2022 is a different story. ED has made clear not only that state assessments must be administered as usual this spring, but that the accountability rules of the Every Student Succeeds Act are back in force. This fall, every state will need to dust off its accountability plan and identify its lowest-performing schools for Comprehensive Support and Improvement (CSI) and schools with low-performing groups of students for Targeted Support and Improvement (TSI).
Insufficient data lead to significant measurement challenges
Many states—perhaps most—do not have sufficient data on school performance to reinstate the accountability measures and rules that they had in place before the pandemic. In particular, 48 states and the District of Columbia include some form of student growth or value-added measure in their usual accountability considerations, and those measures require examining how the achievement of individual students has changed since the preceding year. Most states administered annual assessments in 2021, but often the administration was quite different than in a typical year. Some states shifted their usual spring assessments to the fall; some states adopted shorter versions of assessments that do not produce scores that can be compared to other years; and some states allowed districts to administer assessments anytime between spring and fall. Moreover, many states saw dramatically lower participation rates than usual, with wide variation across schools and districts. Trying to measure growth from such an uncertain baseline is a dubious proposition, posing a risk that schools cannot be fairly assessed. With the help of technical advisory committees, many states are recognizing this dilemma and do not plan to use 2021 test scores as baselines for growth measures.
If states can’t measure growth from 2021, what will they do instead?
Some states might drop their growth measures entirely for 2022, incorporating test results only in the form of current proficiency rates in reading and math. These states will identify schools as low performing based entirely on current student achievement, without incorporating any information on the school’s contribution to student achievement. As a Nobel Prize winner has recently pointed out, measures based entirely on current proficiency rates tend to misidentify the schools that are contributing the least to student learning—in ways that are biased against schools that serve students of color. Proficiency rates tend to flag schools with more students of color as low performing even if they are contributing just as much to their students’ academic growth as schools serving White students.
A potential solution
Fortunately, there is an alternative to relying on biased measures. States are not stuck with dropping student growth entirely, even if they lack useful data from 2021. Instead, states lacking valid baseline test data from 2021 could go back to 2019 for their baselines, measuring cumulative growth across three years. Although states typically measure student growth annually, there is no technical or (federal) legal reason that they could not measure student growth or value-added from 2019 to 2022.
Students in grades 6 through 11 in spring 2022 would generally have baseline scores (from grades 3 through 8) from spring 2019, a year before the pandemic began (see Table 1). Our previous work has shown that student growth across several years can differentiate schools: In Maryland, we found that scores on kindergarten entry assessments can be used as baselines for student growth measures to the end of grade 3. Indeed, growth since 2019 is arguably a better indicator than growth since 2021 of how well a school has promoted student learning through the course of the pandemic.
States without reliable test data from 2021 can still measure growth from 2019 to 2022.
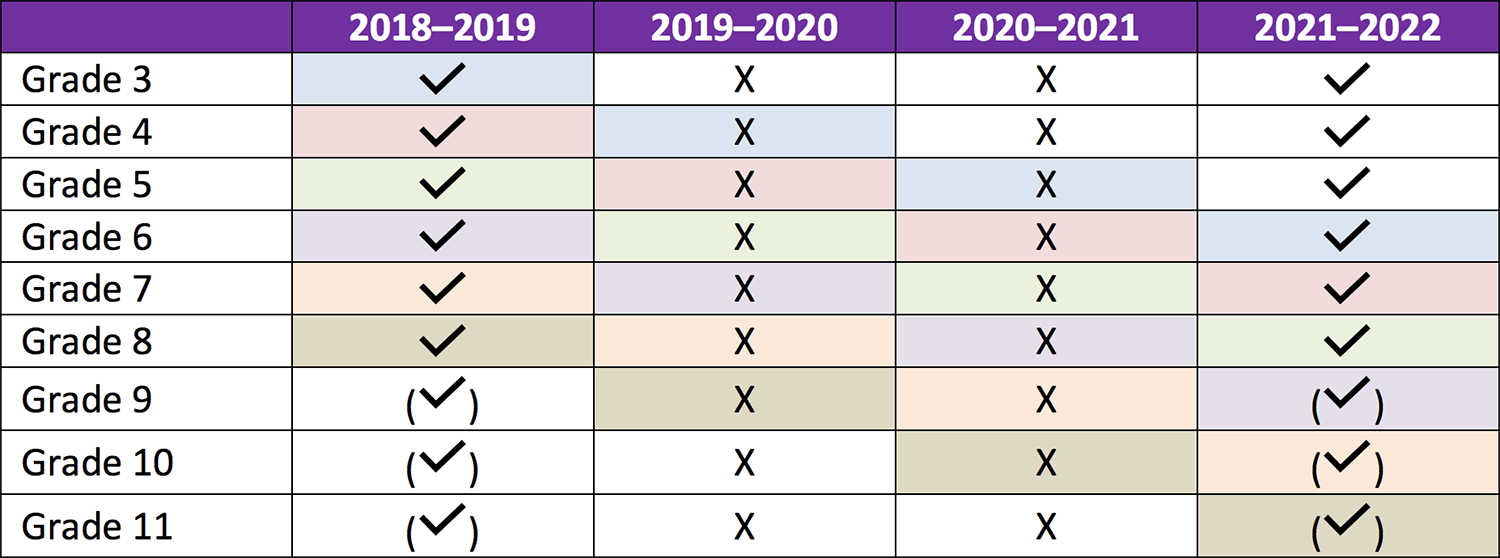
Table 1. Testing data by grade and year, 2018–2019 through 2021–2022, in a state with unreliable 2021 test data. Check marks in parentheses acknowledge that high school testing varies in different states.
Of course, many students will have changed schools from 2019 to 2022, either through natural grade-based progression to the next level or for other reasons. But the statistical methods used in value-added and student-growth models have built-in ways to address this, giving each school a fraction of the student’s growth equivalent to the fraction of the three-year period the student was enrolled in that school. For example, for a 7th grader in 2022 who was in a K–5 elementary school in 2019, one-third of their growth would be attributed to the elementary school and two-thirds to the middle school.
This approach would provide a straightforward measure of student growth—or value-added—for middle schools and high schools in 2022. A credible assessment of growth for K–5 elementary schools is not as straightforward, because students who are in grades 3 to 5 in 2022 do not (in most states) have 2019 state test scores to employ as baselines for growth. Measuring three-year growth with proportional attribution to each school a student enrolled in is at least a partial solution, because students now in grades 6 and 7 were in grades 4 and 5 for part of the intervening period, and those grades would be credited for one-third or two-thirds of the student growth. Other approaches to produce growth-like measures for students currently in elementary grades might exist. But even without other approaches, the proportional growth approach provides some information on elementary growth—which is better than ignoring growth entirely.
Establishing a new community of practice
Because states across the country are facing new challenges in measuring student growth and other aspects of school performance, REL Mid-Atlantic is now establishing a community of practice for state education agencies considering changes to their accountability systems, this year or in the longer term. These challenges of measuring school performance are by no means specific to the mid-Atlantic states, so the community of practice is open to any state agency seeking solutions. Community of practice members will work together with the support of expert REL staff to develop better approaches to identifying low-performing schools. States are also just beginning to face the challenge of determining whether a previously identified school has improved enough to exit low-performing status, and we expect this will be another focus of the community of practice.
To learn more about the new community of practice, or to express your agency’s interest in joining us, please reach out via email to RELMidatlantic@mathematica-mpr.com.
Cross-posted from the REL Mid-Atlantic website.