
Data are not just compliance tools or bureaucratic requirements. They are a powerful resource that can help parents understand their children’s strengths and needs, teachers tailor instruction and interventions, schools identify gaps and opportunities, districts allocate resources and support, and policymakers evaluate policies and programs. When data are not disaggregated, it cannot be used to adequately inform decisions about providing supports to different groups of students. Reporting data as averages hides sub-group or individual performance, but disaggregated data can shift the focus and provide a path to better meet individual needs, especially for Black, Hispanic, low-income, multilingual, and special needs students.
According to a new analysis of data from the 2022–2023 school year, NWEA estimated that most students need 4.5 additional months of math instruction and 4.1 additional months of reading instruction to recover missed pandemic learning—nearly half of a typical school year. However, national data mask important differences in student need across communities. A study about post-COVID-19 test scores from the National Bureau of Economic Research documented that academic recovery varies widely by state, leaving state leaders with an important responsibility to establish their own recovery goals and be transparent about reporting their progress. However, many school and community leaders are still missing important information about how different groups of students in their communities are faring, making it harder to tailor the supports students need and track their progress. Without disaggregated data that shines light on pernicious inequities, school leaders may be designing new interventions and programs for the average student and not for the students who need the most support. That is why states need to report better disaggregated data on students' pandemic recovery.
The Center on Reinventing Public Education (CRPE) has consistently called on states to provide timely, accurate, and relevant data to the public about their progress toward pandemic recovery. This year’s State of the American Student report is urging state leaders to set ambitious goals for recovery with a commitment to reporting progress and establishing radical transparency. The Data Quality Campaign confirmed many states have a ways to go in data reporting and transparency. For example, in their 2021–2022 state report cards, nine states did not provide disaggregated assessment data by student group.
To support pandemic recovery efforts across diverse communities, there is an urgent need for states to work alongside superintendents, principals, teachers, families, and community partners to draw on their existing data infrastructure and establish new reporting tools that are meaningful and useful for helping users understand different student groups. Based on common reporting tools, like report cards and test scores, most parents and community members still need clarification about the immediate challenges that students face. States do not need to start from scratch. The new Education-to-Workforce Indicator Framework (E-W Framework) provides comprehensive guidance about how to measure and disaggregate their data, and once they have that information, offers evidence-based practices that can help them to act on the data that matter most to help every student succeed.
States should partner with community advocates to identify the most important metrics that establish transparency about student and school outcomes
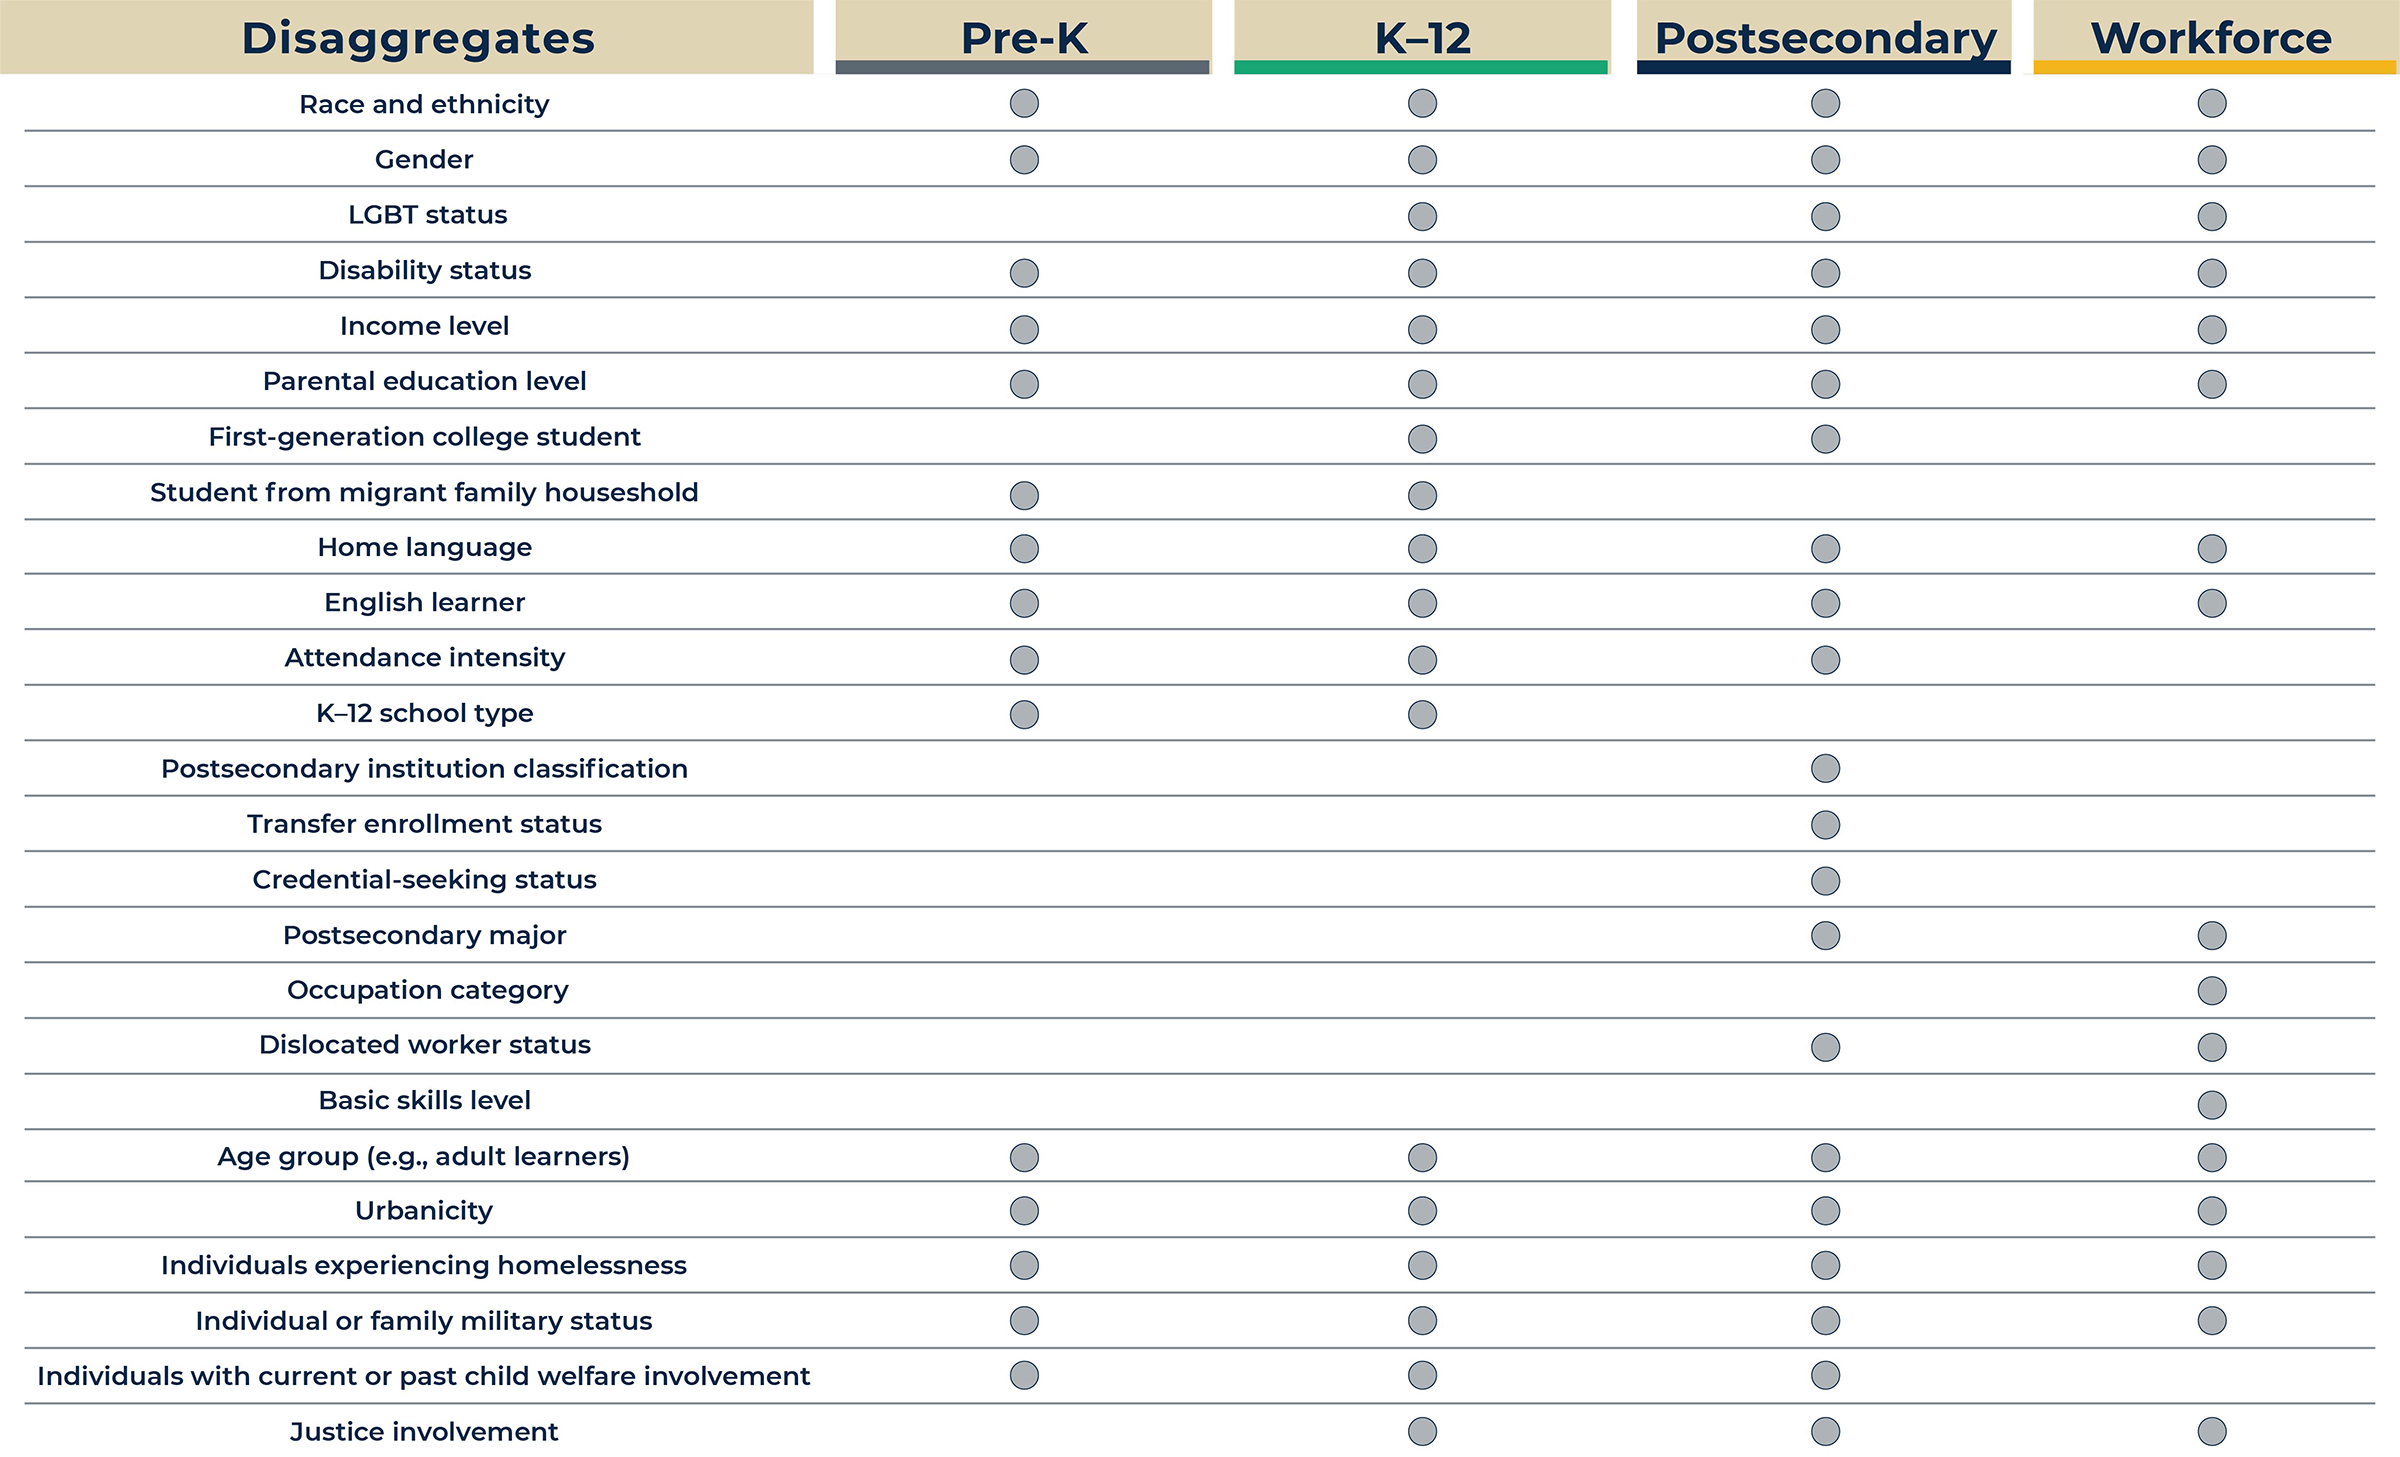
When states set their pandemic recovery goals for schools and students, they should talk to advocates and community leaders to select the indicators that reflect their vision and values for education. The E-W Framework offers 99 indicators that show how students are faring from early education through their career, based on research and expert input. These indicators matter for helping students advance through school, live fulfilling lives, and experience success in college and the workforce.
Education Forward Arizona, a coalition of statewide advocacy organizations, offers a successful model of using meaningful, disaggregated data to make informed decisions. They convened more than 200 people and organizations when determining the indicators to measure and track. The resulting statewide data dashboard—the Education Progress Meter—provides information about how the state’s students are progressing toward their goals from early learning to postsecondary attainment. The indicators include early childhood factors such as high-quality early learning (that is, the percentage of 3- and 4-year-olds attending high-quality early learning settings) and postsecondary indicators such as the proportion of opportunity youth (that is, the percentage of 16- to 24-year-olds in Arizona not going to school or working). The statewide dashboard provides an overview of progress overall and, critically, the opportunity for users to unpack how specific communities and demographic groups are progressing toward achieving these goals compared to their peers.
States should ensure disaggregated data reports are meaningful and action-oriented
To promote economic mobility and equity, states must report data on education and workforce outcomes and conditions in ways that are easy to understand and act upon. Disaggregating data is an important way to understand who to support and how to be most effective in improving outcomes. States can follow the example in Arizona and use the E-W Framework as a first step for reporting meaningful data. The E-W Framework provides a set of 25 characteristics that can help states disaggregate data by different student groups and system factors to reveal gaps, patterns, and opportunities for improvement.
Some states already prioritize data disaggregation. For example, North Carolina’s Strategic Dashboard Monitoring Tool helps users explore how counties are progressing toward statewide strategic goals. Most importantly, the dashboard allows users to explore the progress within a county or school by race, special education status and gender. Similarly, Washington D.C.’s Report Card Dashboard provides disaggregated information about important indicators such as chronic absenteeism. An important feature of the dashboard is that it allows users to compare schools by various indicators and explore equity outcomes by student group across their local community.
Drilling into these state and local dashboards, school leaders and parents can find information about how their school or district is faring compared to other locations across the state. More importantly, data users can explore how students with disabilities, students from economically disadvantaged backgrounds, or racially diverse students are faring compared to their peers and the state average. The ability to understand nuanced experiences in school via standardized measures empowers educational leaders to make important shifts in their resource and programmatic decisions. The Virginia Visualization and Analytics Solution (VVAAS) dashboard tool is helping Virginia parents understand how their children are performing and growing academically, as well as how they compare to their peers across the state and the nation. By providing individualized student reports directly to parents, the VVAAS dashboard and upcoming parent portal will help the Virginia Department of Education commit to radical transparency and accountability for pandemic recovery.
Students are counting on us to provide them an immediate path forward
The pandemic disrupted the education and career paths of millions of U.S. students. They faced academic challenges, social isolation, and mental health issues that previous cohorts did not experience. To help these students recover, states must collect and report disaggregated data on their academic progress, mental well-being, and readiness for college and career. CRPE’s 2023 State of the American Student report offers a snapshot of how U.S. students are faring in these areas, as well as insights into the state of the education system and the innovations that are emerging to improve data and transparency.
Some states, like Louisiana and the states above, are establishing comprehensive public longitudinal data systems connected to their strategic statewide goals that can help partners answer essential questions about student success and track pandemic recovery efforts. These states are taking important first steps to use data and transparency as drivers for addressing students’ needs. They have engaged with various interest holders, such as educators, families, and community partners, to create data dashboards and reports that are meaningful and useful for different student groups. More states can follow their examples and draw on existing resources. As more states take on the important work of developing and improving these critical data systems, the E-W Framework offers a comprehensive guide for states to measure, disaggregate, and act on the data that matter most for student success.