
Spatial Distributions in Disaster Risk Vulnerability for People with Disabilities in the U.S.
Download
Background
The spread of Coronavirus Disease 2019 (COVID-19) in the United States has centered the role of natural hazards such as pandemics into the public health sphere. The impacts of these hazards disproportionately affect people with disabilities, who are frequently in situations of social, political, or economic disadvantage. Because of these disadvantages, people with disabilities may have less access to necessary resources and services, putting them at risk due to unmet health needs. These disparities in access also highlight important regional, state, and county-level differences with regards to vulnerability and preparedness for natural hazards.
Objective
The objective of this paper is to examine the relationship between disability and disaster risk in the United States. We examine the geographic variation in the relationship between risk from natural disasters and the percentage of people with disabilities living in a community. Because emergency management functions in the U.S. are directed and enacted at the county level, we also explore how these relationships change across U.S. counties. In addition to the overall prevalence of people with disabilities, we disaggregate the population of people with disabilities by gender, race, ethnicity, age, and disability impairment type.
Methods
To measure risk of natural hazards, we use Expected Annual Loss index, a component of the 2020 National Risk Index, developed by Federal Emergency Management Agency, which identifies communities most at risk to18 natural hazards. We measure the percent of people with disabilities per county using the American Community Survey. We estimate the nationwide relationship between the proportion of people with disabilities and risk of natural hazards using ordinary least squares regression. To explore geographic differences in these relationships across the United States, we use a geographically weighted regression model to estimate local relationships for each county in the contiguous United States. We use mapping techniques to display regional differences across different disability demographic groups.
Results
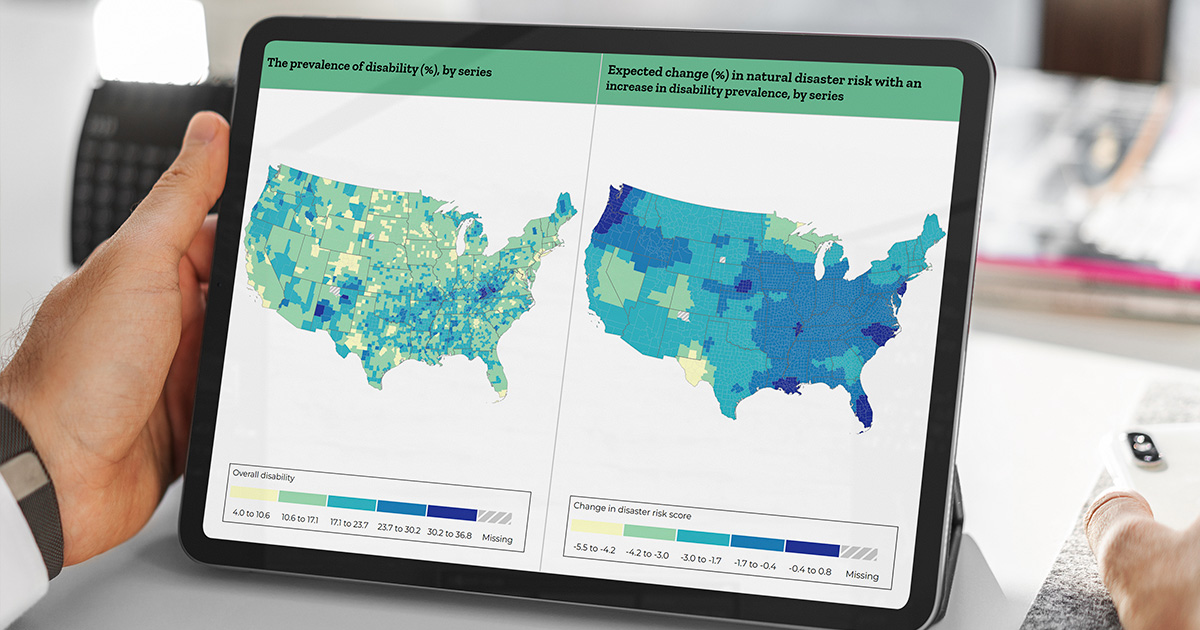
Counties with higher percentages of people with disabilities have a lower risk of natural disasters. Across the United States, a one percent increase in prevalence of people with disabilities in a county is associated with two percent decrease in the natural hazard risk score. Small but statistically significant regional differences exist as well. County-specific estimates range from a five percent decrease to a one percent increase. Stronger associations between risk and the prevalence of people with disabilities are observed in the Midwest and parts of the Southwest and West, whereas the relationship across racial groups is more scattered across the United States.
Conclusion
In this study, nationwide results suggest that people with disabilities are more likely to live in communities with lower risk of natural hazards, but this relationship differs across U.S. counties and by demographic subgroups. These findings represent a contribution in further understanding the health and well-being of people with disabilities in the United States and the geographic variation therein.
More like this from Mathematica
Featured Data Visualization
County Disability and Natural Disasters Maps
Efficiency Meets Impact.
That's Progress Together.
To solve their most pressing challenges, organizations turn to Mathematica for deeply integrated expertise. We bring together subject matter and policy experts, data scientists, methodologists, and technologists who work across topics and sectors to help our partners design, improve, and scale evidence-based solutions.
Work With Us