We are part of a team at Mathematica composed of designers and developers who work on health research projects. We’re always looking for ways to strengthen our capacity to make data-driven insights more intelligible and accessible for clients and the public. One way is to use mentoring and teaching opportunities to bring new talent on board—people with a diverse range of experiences and cultural backgrounds. For the last two summers, our team has been fortunate to host interns as part of an initiative in the Health Unit and Mathematica’s structured summer internship program.
When our team decided to create a web development internship, we knew we wanted to make our program stand out from those of other tech companies. To introduce interns to our design and development processes and a core competency of our group—data visualization—we organized a data visualization course that contains design and D3.js (JavaScript library used to build interactive data visualizations for the web) components. The course culminates in a capstone visualization tool that relies on open-source data or current data from health policy projects. Interns worked with web developers on active projects throughout the summer to get a sense of what life on the web development team is really like. Our team also held an inclusivity workshop to discuss equity and inclusion awareness in data visualizations that interns attended.
We love getting to know our interns throughout the summer and look forward to working with more in years to come. To paint a more detailed picture of what applicants might gain from the experience, we asked two former interns, who are now part of our team full time, to reflect on their time as summer interns. Here’s what they said.
- What interested you in a web development internship at a policy research firm?
Tom Coile, software engineer:
I was interested in the capacity of interactive data visualizations to effectively communicate complicated concepts and to make the exploration of giant data sets accessible to a lay audience. There were a couple of things I loved about this internship that made me decide to apply. First, the position involved a clear commitment to learning. Though I had some experience with D3 , I was rusty, and I hadn’t approached design in a thoughtful, structured way before, so I was really excited for both the D3 and design courses. Second, I loved that I’d be working on an actual project, not siloed off somewhere working on exercises for interns with no real-world impact.
Randy Morantes, software engineer:
Although I’m concerned about the social consequences of technological changes occurring now and in the future, I also believe that, just as technology has the power to create and worsen problems, so too can it mitigate and resolve them. I’m all about the latter.
The next logical step for me, then, was to become technically proficient and seek opportunities at the intersection of technology and solving social problems. This is how I came to learn and love web development, and it’s also how I came across Mathematica. A web development internship with an employee-owned company that uses data-driven approaches to improve public well-being? Yes, please!
- What did you accomplish during the internship that you are most proud of?
Tom:
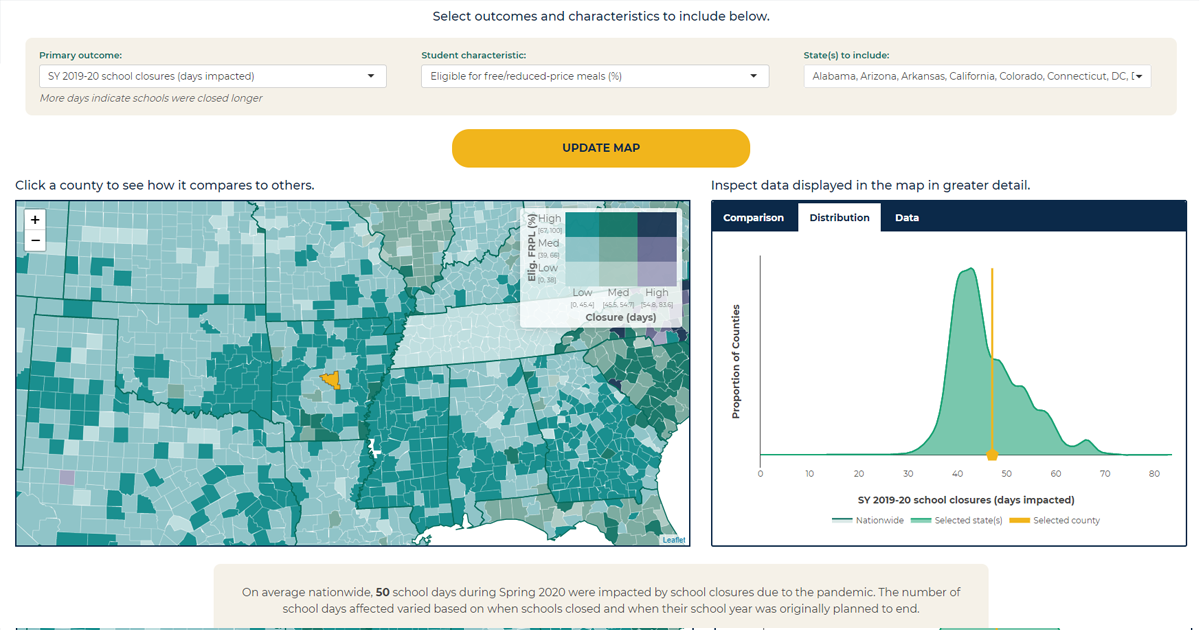
I was part of a team that was creating a digital report on a group of programs being supported by government grants. One of the first visualizations we needed to create was a map with little dots on it showing the locations of each grantee. Whenever a user hovered over a dot, a little tooltip needed to appear with specific information about the program, such as how much money it had received and how many people it served. It sounds simple, but it took weeks to figure out, and it’s the work I’m proudest of. There are so many little things that took forever to figure out—for instance, did you know that simply having a tooltip appear when you hover over a dot isn’t actually the most user-friendly approach? And don’t get me started on the number of different things I tried before the map resized smoothly and correctly.
Randy:
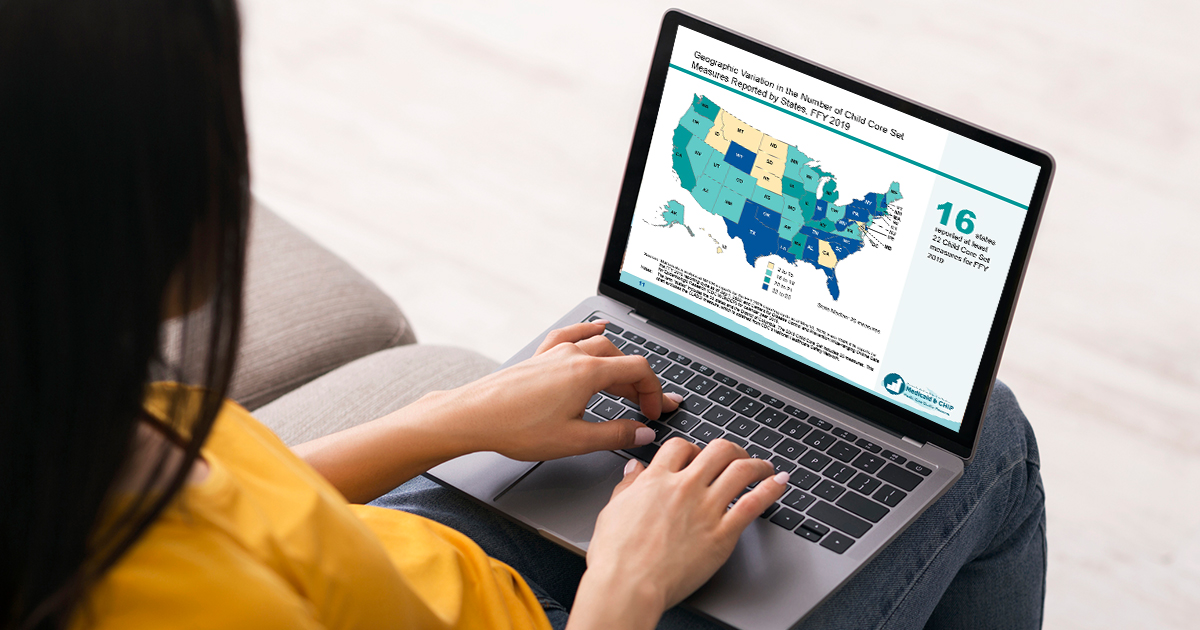
That would be the Massachusetts COVID-19 interactive dashboard I made for my final project, which was essentially a scatter plot, a bar chart, and a map. In addition to showing the number of cases at the county level, I also wanted to highlight how various factors such as wealth and race/ethnicity affected the distribution of cases. Locating and formatting such data were very time consuming, so I ultimately included only wealth as a factor. That alone was interesting because it showed a strong negative correlation between wealth and cases.
- What was one thing you learned during your internship that you were not expecting?
Tom:
My assumption coming into the internship was that, as an intern, I would be primarily integration testing or end-to-end testing code that other people had written. But the project I was assigned was still in its early phases, so I had the opportunity to help with development using Angular as the front-end framework. I left feeling much more comfortable with Angular than I was expecting.
I also learned a lot about communication in the design phase. The art of brainstorming together during design; how to talk with researchers (especially during our capstone project) and present wireframes for feedback; how to establish my own credibility as a designer and developer while working with subject matter experts; and how to talk more rigorously and specifically about design decisions.
Randy:
The biggest surprise to me was the extent to which web development is more than just coding. There’s a lot of communication—emails, code reviews, quality assurance reviews, sprint meetings, and so on—that goes into the process to ensure the work I produce is the work that’s needed.
- What does the intersection between technology and policy research mean to you?
Tom:
To me, the intersection between technology and policy research means communicating. I think technology (when it comes to data, often that’s data visualization) is one of the best means we have to compellingly convey research findings in a flexible manner, exposing information in a way that allows end users to dig as deep as they need to make complicated, informed policy decisions.
Randy:
It means using the good parts of technology to offset the bad on a societal level. In this effort, I see my role as enhancing the effectiveness of Mathematica’s amazing researchers by helping them surface and communicate insights from data to policy decision makers.
Applications for Mathematica’s web development summer internship program will open in the Mathematica careers portal in November 2021.